OPEN-SOURCE SCRIPT
Bitcoin Stalemate Indicator
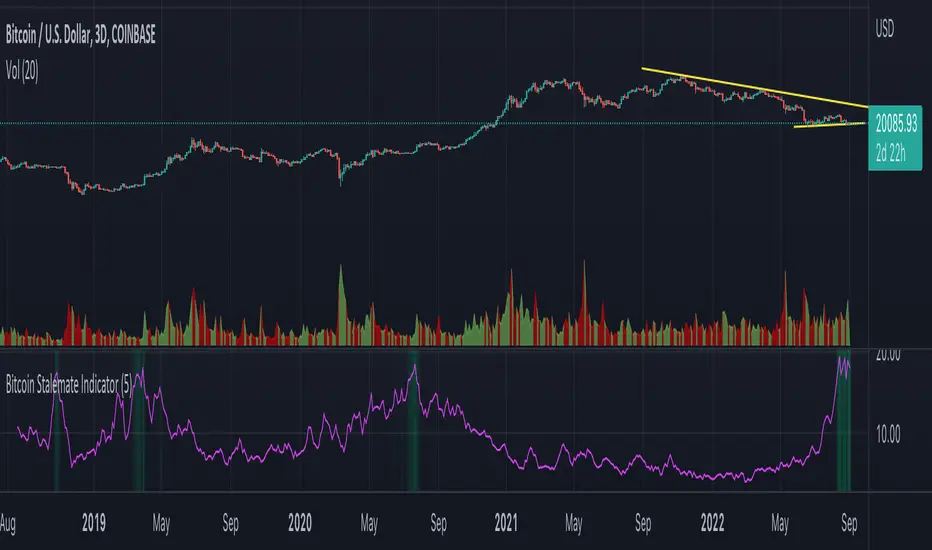
The Bitcoin Stalemate Indicator examines periods in the market defined by a combination of high volume and low price volatility. These periods are a bit like a tug-of-war with both sides applying a lot of force but the rope moving very little. Periods of high volume and low volatility suggest both sides of the trade are stuck in a stalemate. This indicator may be useful in identifying psychologically important price levels.
The mechanics of the indicator are fairly simple: the indicator takes the volume and divides it by the candle’s size over it’s close for that same period.
volume / ((high - low) / close)
Candles that move very little but with high volume will produce higher reads and vice versa. Finally a smoothing average is applied to clean up the noise.
Volume profiles from the top 6 exchanges are averaged in order to avoid a single exchange’s popularity acting as an overriding factor. Single exchanges can be isolated but are of lesser use. Heat map functionality is only active when all exchanges are selected.
開源腳本
秉持TradingView一貫精神,這個腳本的創作者將其設為開源,以便交易者檢視並驗證其功能。向作者致敬!您可以免費使用此腳本,但請注意,重新發佈代碼需遵守我們的社群規範。
免責聲明
這些資訊和出版物並非旨在提供,也不構成TradingView提供或認可的任何形式的財務、投資、交易或其他類型的建議或推薦。請閱讀使用條款以了解更多資訊。
開源腳本
秉持TradingView一貫精神,這個腳本的創作者將其設為開源,以便交易者檢視並驗證其功能。向作者致敬!您可以免費使用此腳本,但請注意,重新發佈代碼需遵守我們的社群規範。
免責聲明
這些資訊和出版物並非旨在提供,也不構成TradingView提供或認可的任何形式的財務、投資、交易或其他類型的建議或推薦。請閱讀使用條款以了解更多資訊。