OPEN-SOURCE SCRIPT
Rate of Change of OBV with RSI Color
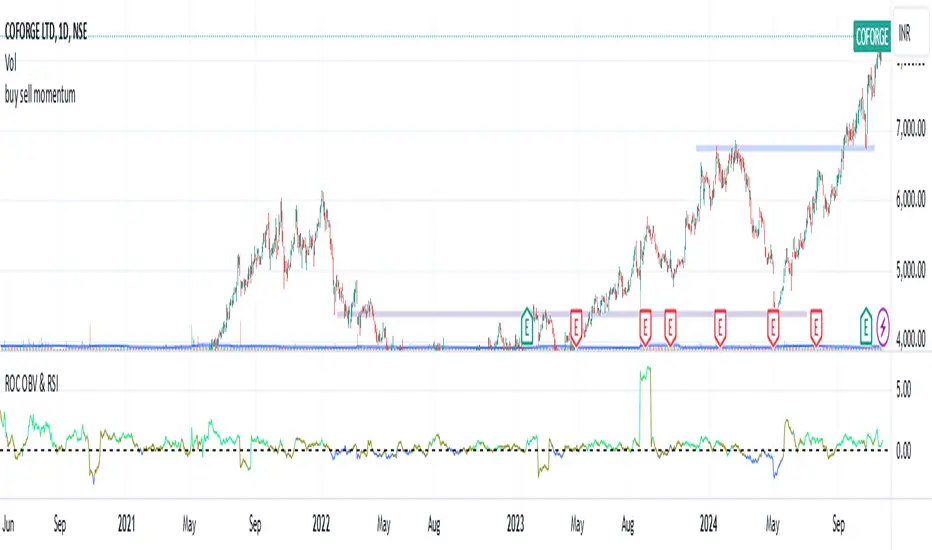
This indicator combines three popular tools in technical analysis: On-Balance Volume (OBV), Rate of Change (ROC), and Relative Strength Index (RSI). It aims to monitor momentum and potential trend reversals based on volume and price changes.
Calculation:
ROC(OBV) = ((OBV(today) - OBV(today - period)) / OBV(today - period)) * 100
This calculates the percentage change in OBV over a specific period. A positive ROC indicates an upward trend in volume, while a negative ROC suggests a downward trend.
What it Monitors:
OBV: Tracks the volume flow associated with price movements. Rising OBV suggests buying pressure, while falling OBV suggests selling pressure.
ROC of OBV:
Measures the rate of change in the OBV, indicating if the volume flow is accelerating or decelerating.
RSI: Measures the strength of recent price movements, indicating potential overbought or oversold conditions.
How it can be Used:
Identifying Trend Continuation: Rising ROC OBV with a rising RSI might suggest a continuation of an uptrend, especially if the color is lime (RSI above 60).
Identifying Trend Reversal: Falling ROC OBV with a declining RSI might suggest a potential trend reversal, especially if the color approaches blue (RSI below 40).
Confirmation with Threshold: The horizontal line (threshold) can be used as a support or resistance level. Bouncing ROC OBV off the threshold with a color change could suggest a pause in the trend but not necessarily a reversal.
When this Indicator is Useful:
This indicator can be useful for assets with strong volume activity, where tracking volume changes provides additional insights.
It might be helpful during periods of consolidation or trend continuation to identify potential breakouts or confirmations.
開源腳本
秉持TradingView一貫精神,這個腳本的創作者將其設為開源,以便交易者檢視並驗證其功能。向作者致敬!您可以免費使用此腳本,但請注意,重新發佈代碼需遵守我們的社群規範。
免責聲明
這些資訊和出版物並非旨在提供,也不構成TradingView提供或認可的任何形式的財務、投資、交易或其他類型的建議或推薦。請閱讀使用條款以了解更多資訊。
開源腳本
秉持TradingView一貫精神,這個腳本的創作者將其設為開源,以便交易者檢視並驗證其功能。向作者致敬!您可以免費使用此腳本,但請注意,重新發佈代碼需遵守我們的社群規範。
免責聲明
這些資訊和出版物並非旨在提供,也不構成TradingView提供或認可的任何形式的財務、投資、交易或其他類型的建議或推薦。請閱讀使用條款以了解更多資訊。