OPEN-SOURCE SCRIPT
Efficiency Ratio
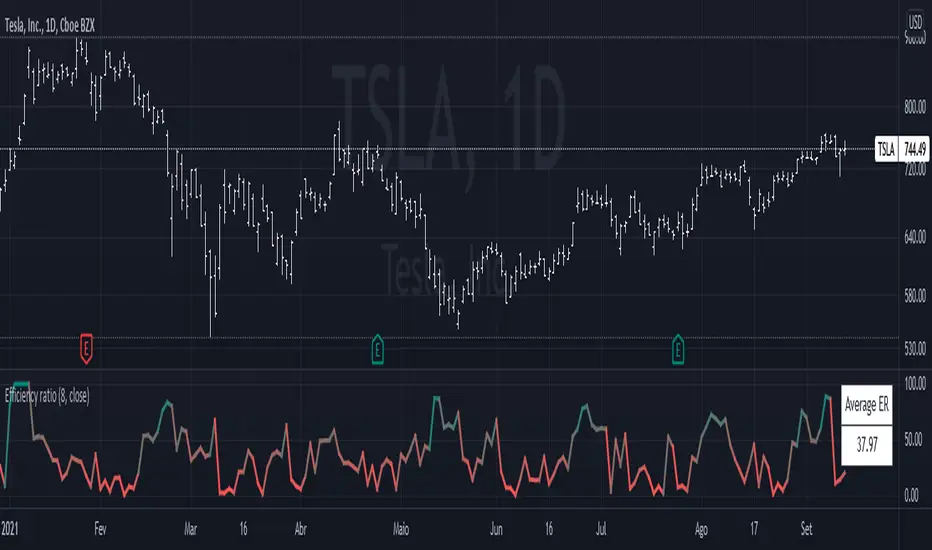
The efficiency ratio (ER) is described by Perry Kaufman in his book, Trading Systems and Methods.
It works by measuring the momentum of the market, that is, the absolute change from the current price to a past price, and divides it by the volatility, which is the sum of the absolute changes of each bar. That makes this a bounded indicator, going from 0 to 100, like an oscillator. Higher values mean less noise, while lower values mean more.
Eg.: if the market moves from 10.0 to 15.0 in a directional manner, with every bar up, the ER is going to be at 100. However, if it moves up and down, and goes all over the place until finally reaching 15.0, the ER is going to be at around 20. It is very difficult for the ER to be at zero, because that would require 0 volatility, which is almost impossible to occur.
This indicator is useful when planning for trades. If you notice the ER being higher than average, you may choose to increase the position size, because that would mean that the market is directional and has less chance of a whipsaw.
開源腳本
本著TradingView的真正精神,此腳本的創建者將其開源,以便交易者可以查看和驗證其功能。向作者致敬!雖然您可以免費使用它,但請記住,重新發佈程式碼必須遵守我們的網站規則。
免責聲明
這些資訊和出版物並不意味著也不構成TradingView提供或認可的金融、投資、交易或其他類型的意見或建議。請在使用條款閱讀更多資訊。
開源腳本
本著TradingView的真正精神,此腳本的創建者將其開源,以便交易者可以查看和驗證其功能。向作者致敬!雖然您可以免費使用它,但請記住,重新發佈程式碼必須遵守我們的網站規則。
免責聲明
這些資訊和出版物並不意味著也不構成TradingView提供或認可的金融、投資、交易或其他類型的意見或建議。請在使用條款閱讀更多資訊。