OPEN-SOURCE SCRIPT
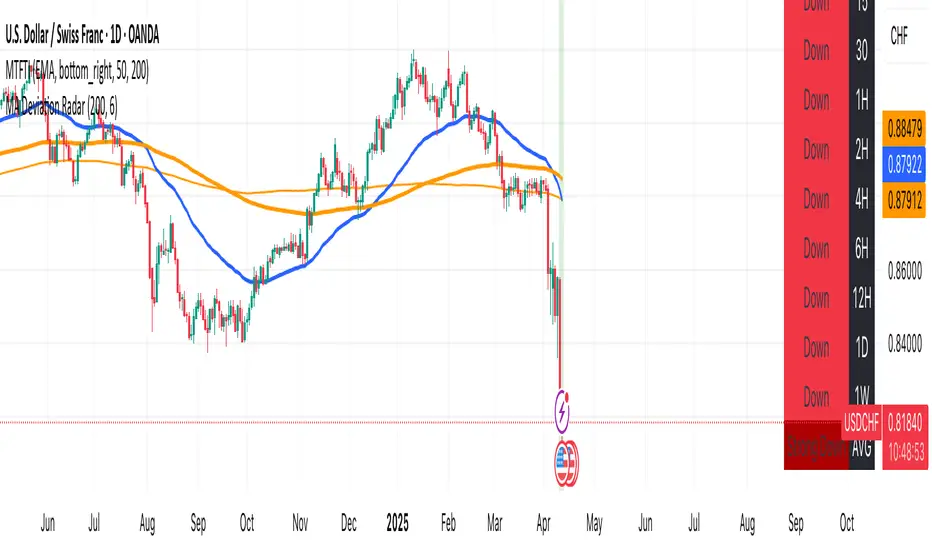
MA Deviation
// -----------------------------------------------------------------------------
// MA Deviation Marking & Alert (MA Divergence)
// -----------------------------------------------------------------------------
// Short Title: MA Deviation Radar
// Author: zhipeng luo
// Version: 1.0
// Date: 2025-04-11
// -----------------------------------------------------------------------------
// Overview:
// This indicator identifies and highlights price bars where the closing price
// deviates significantly from its Simple Moving Average (SMA) by a user-defined
// percentage. It visually marks these bars on the chart and provides
// configurable alert conditions for threshold breaches.
//
// How it Works:
// 1. Calculates the Simple Moving Average (SMA) based on the 'MA Period' input.
// 2. Computes the percentage deviation of the closing price from the SMA value.
// Formula: `((Close - SMA) / SMA) * 100`
// 3. Compares the calculated deviation percentage against the positive and
// negative 'Threshold (%)' input values.
// 4. Marks the background of the price bars when a threshold is exceeded:
// - Red Background: Price deviation is greater than the positive threshold.
// - Green Background: Price deviation is less than the negative threshold.
// 5. Includes an optional, non-visible plot of the MA line itself.
// 6. Offers three distinct alert conditions for automation and notifications.
//
// Features:
// - Customizable Simple Moving Average period.
// - Adjustable deviation threshold percentage.
// - Clear visual signals using background colors on the main chart.
// - Built-in Alert Conditions:
// - MA Positive Deviation Alert (Triggers when price > MA + Threshold %)
// - MA Negative Deviation Alert (Triggers when price < MA - Threshold %)
// - MA Deviation Alert - Any (Triggers on either positive or negative breach)
//
// How to Use:
// - Identify Potential Extremes: Useful for spotting potential overbought (large
// positive deviation) or oversold (large negative deviation) conditions
// which might precede price corrections or mean reversion.
// - Gauge Trend Extension: Extreme deviations can sometimes indicate that a
// trend is overextended and might be due for a pause or reversal.
// - Parameter Tuning: Adjust the 'MA Period' and '(Threshold %)' settings to
// suit the specific asset, timeframe, and volatility characteristics you
// are analyzing. Lower thresholds yield more signals; higher thresholds
// focus on more significant deviations.
// - Alerts: Set up alerts via the TradingView alert menu using the provided
// conditions ("MA Positive Deviation Alert", "MA Negative Deviation Alert",
// "MA Deviation Alert - Any") to get notified of potential setups.
//
// Parameters:
// - MA Period (Default: 200): The lookback period for the SMA calculation.
// - (Threshold %) (Default: 7.0): The percentage deviation (positive and
// negative) from the MA required to trigger a background signal and alert.
//
// Alerts & Important Note:
// Three alert conditions corresponding to the signals are available:
// 1. "MA Positive Deviation Alert"
// 2. "MA Negative Deviation Alert"
// 3. "MA Deviation Alert - Any"
//
// ***Please Note:*** The value shown after "( {{plot_0}}%)" or
// "( {{plot_0}}%)" in the default alert message refers to the
// **Moving Average value** (`plot_0`), not the actual deviation percentage.
// The alert *triggers correctly* based on the deviation percentage crossing
// the threshold, but the number displayed by the `{{plot_0}}` placeholder
// in the message is the MA's value at that time due to the script's
// internal plot order.
//
// Disclaimer: This indicator is provided for informational and analytical
// purposes only. It does not constitute financial advice or a recommendation
// to buy or sell any asset. Always conduct your own research and use proper
// risk management. Trading involves significant risk.
// -----------------------------------------------------------------------------
開源腳本
秉持TradingView一貫精神,這個腳本的創作者將其設為開源,以便交易者檢視並驗證其功能。向作者致敬!您可以免費使用此腳本,但請注意,重新發佈代碼需遵守我們的社群規範。
免責聲明
這些資訊和出版物並非旨在提供,也不構成TradingView提供或認可的任何形式的財務、投資、交易或其他類型的建議或推薦。請閱讀使用條款以了解更多資訊。
開源腳本
秉持TradingView一貫精神,這個腳本的創作者將其設為開源,以便交易者檢視並驗證其功能。向作者致敬!您可以免費使用此腳本,但請注意,重新發佈代碼需遵守我們的社群規範。
免責聲明
這些資訊和出版物並非旨在提供,也不構成TradingView提供或認可的任何形式的財務、投資、交易或其他類型的建議或推薦。請閱讀使用條款以了解更多資訊。