OPEN-SOURCE SCRIPT
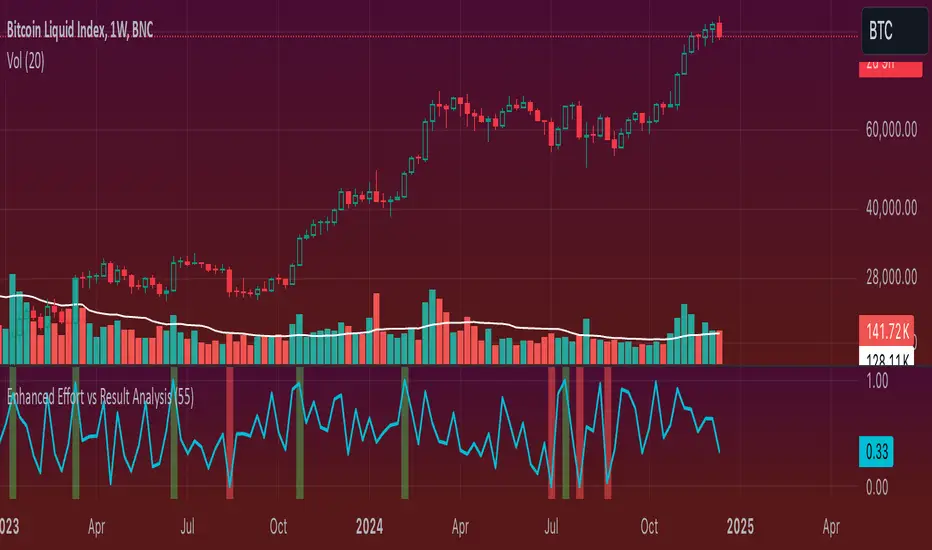
Enhanced Effort vs Result Analysis V.2
How to Use in Trading
A. Confirm Breakouts
Check if the Effort-Result Ratio or Z-Score spikes above the Upper Band or Z > +2:
Suggests a strong, efficient price move.
Supports breakout continuation.
B. Identify Reversal or Exhaustion
Look for Effort-Result Ratio or Z-Score dropping below the Lower Band or Z < -2:
Indicates high effort but low price movement (inefficiency).
Often signals potential trend reversal or consolidation.
C. Assess Efficiency of Trends
Use Relative Efficiency Index (REI):
REI near 1 during a trend → Confirms strength (efficient movement).
REI near 0 → Weak or inefficient movement, likely signaling exhaustion.
D. Evaluate Volume-Price Relationship
Monitor the Volume-Price Correlation:
Positive correlation (+1): Confirms price is driven by volume.
Negative correlation (-1): Indicates divergence; price moves independently of volume (potential warning signal).
3. Example Scenarios
Scenario 1: Breakout Confirmation
Effort-Result Ratio spikes above the Upper Band.
Z-Score exceeds +2.
REI approaches 1.
Volume-Price Correlation is positive (near +1).
Action: Strong breakout confirmation → Trend continuation likely.
Scenario 2: Reversal or Exhaustion
Effort-Result Ratio drops below the Lower Band.
Z-Score is below -2.
REI approaches 0.
Volume-Price Correlation weakens or turns negative.
Action: Signals trend exhaustion → Watch for reversal or consolidation.
Scenario 3: Range-Bound Market
Effort-Result Ratio stays within the Bollinger Bands.
Z-Score remains between -1 and +1.
REI fluctuates around 0.5 (neutral efficiency).
Volume-Price Correlation hovers near 0.
Action: Normal conditions → Look for breakout signals before acting.
*IMPORTANT*
There is a problem with the overlay ... How to fix some of it
The Standard Deviation bands dont work while the other variable activated so Id suggest deselecting them. The fix for this is to make sure you have the background selected and by doing this it will highlight on the chart ( you may need to increase the opacity ) when the bands ( Second standard deviation) are touched.
- Also you can use them all at once if you can but you do not need to
開源腳本
秉持TradingView一貫精神,這個腳本的創作者將其設為開源,以便交易者檢視並驗證其功能。向作者致敬!您可以免費使用此腳本,但請注意,重新發佈代碼需遵守我們的社群規範。
免責聲明
這些資訊和出版物並非旨在提供,也不構成TradingView提供或認可的任何形式的財務、投資、交易或其他類型的建議或推薦。請閱讀使用條款以了解更多資訊。
開源腳本
秉持TradingView一貫精神,這個腳本的創作者將其設為開源,以便交易者檢視並驗證其功能。向作者致敬!您可以免費使用此腳本,但請注意,重新發佈代碼需遵守我們的社群規範。
免責聲明
這些資訊和出版物並非旨在提供,也不構成TradingView提供或認可的任何形式的財務、投資、交易或其他類型的建議或推薦。請閱讀使用條款以了解更多資訊。