OPEN-SOURCE SCRIPT
已更新 Bitcoin ETF Cumulative Net Inflow
Indicator Description:
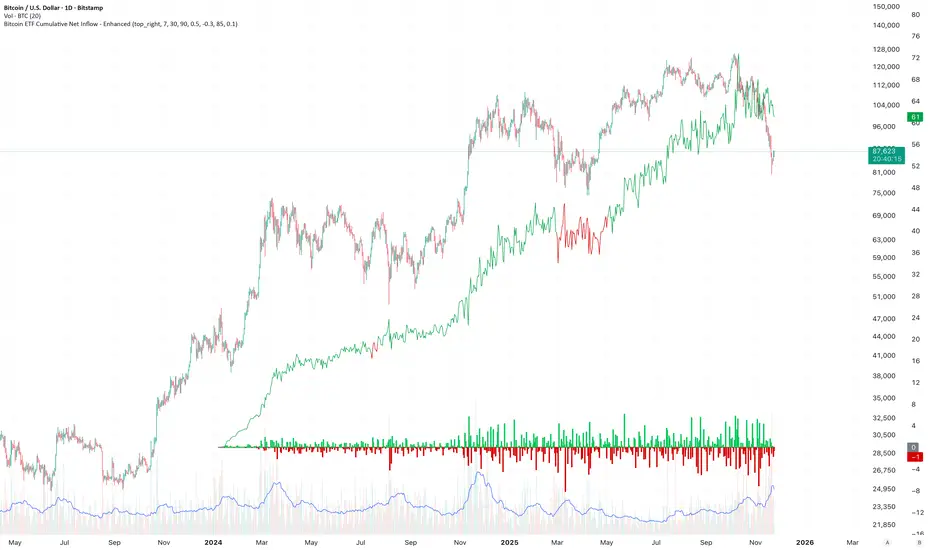
This indicator calculates and plots the cumulative net inflow (in billions of USD) for selected Bitcoin ETFs on the main price chart. It uses AUM data from TradingView to estimate daily net flows, adjusted for BTC price changes, and accumulates them over time. The line is overlaid on the price chart (e.g., BTCUSD) with a right scale for better visibility, helping to identify correlations between ETF inflows and Bitcoin price movements.
Key Features:
Supports selection of 10 major Bitcoin ETFs (IBIT, FBTC, ARKB, etc.) via inputs.
Cumulative inflow line (purple, linewidth=2) for trend analysis.
Data sourced from request.financial("AUM", "D") for accuracy.
發行說明
V2.0## Overview
This advanced indicator tracks the cumulative net capital flows into Bitcoin Spot ETFs by analyzing Assets Under Management (AUM) data adjusted for BTC price movements. Unlike simple volume tracking, this indicator isolates actual investor capital inflows and outflows by filtering out price-driven AUM changes.
## Key Features
### 📊 Enhanced Visualization
- **Cumulative Flow Line**: Purple line showing total net inflows since ETF launch (January 2024)
- **Daily Flow Histogram**: Color-coded bars (green = inflow, red = outflow) displaying daily capital movements
- **Moving Averages**: Optional 7-day and 30-day MAs to identify flow trends
- **Data Table**: Detailed breakdown by individual ETF (optional, toggle in settings)
- **Event Labels**: Automatic markers for record inflows/outflows and new ATHs
### 🎯 Tracked ETFs (10 Total)
- **IBIT** (BlackRock) - Typically the largest flow contributor
- **FBTC** (Fidelity)
- **ARKB** (ARK Invest)
- **BITB** (Bitwise)
- **HODL** (VanEck)
- **BRRR** (Valkyrie)
- **BTCO** (Invesco)
- **EZBC** (Franklin Templeton)
- **BTCW** (WisdomTree)
- **GBTC** (Grayscale) - Important for tracking outflows
### 🔔 Smart Alert System (7 Alert Types)
1. **Large Inflow Alert**: Triggers on significant positive flows (customizable threshold)
2. **Large Outflow Alert**: Triggers on significant negative flows (customizable threshold)
3. **Flip to Net Inflow**: Detects trend reversal from outflow to inflow
4. **Flip to Net Outflow**: Detects trend reversal from inflow to outflow
5. **New Cumulative ATH**: Signals new all-time high in total cumulative inflows
6. **Record Daily Inflow**: Identifies largest single-day inflow events
7. **Record Daily Outflow**: Identifies largest single-day outflow events
### ⚙️ Comprehensive Settings
- **ETF Selection**: Enable/disable individual ETFs to focus on specific funds
- **Display Options**: Toggle table, histogram, MAs, fills, and labels independently
- **Analytics**: Customize MA periods (default: 7 & 30 days) and lookback periods
- **Alert Thresholds**: Set custom values for large inflow/outflow alerts
- **Visual Customization**: Full color control for all plot elements
## Use Cases
### 1. Sentiment Analysis
Monitor institutional capital allocation to BTC. Sustained inflows suggest strengthening conviction, while outflows may indicate profit-taking or concerns.
### 2. Divergence Trading
Compare ETF flows with BTC price action:
- **Bullish Divergence**: Price falling but inflows increasing → Potential accumulation
- **Bearish Divergence**: Price rising but outflows increasing → Potential distribution
### 3. Trend Confirmation
Use cumulative flow direction to confirm price trends:
- Rising cumulative line + rising BTC price = Strong uptrend confirmation
- Falling cumulative line during rallies = Weak hands, potential reversal
### 4. GBTC Monitoring
Track GBTC separately to understand legacy holder behavior and potential rotation into new ETFs.
### 5. Volume Spike Analysis
Large daily flow spikes often precede or confirm significant market moves. Use alerts to catch these events in real-time.
### 6. MA Crossovers
Enable MAs to identify flow trend changes:
- 7-day MA crossing above 30-day MA = Accelerating inflows
- 7-day MA crossing below 30-day MA = Weakening flows
## Technical Methodology
**Flow Calculation:**
```
Net Flow = Current AUM - Expected AUM
Expected AUM = Previous AUM × (1 + BTC Return)
```
This methodology isolates capital flows by removing AUM changes caused by BTC price movements, revealing true investor behavior.
**Data Source:** TradingView's financial data (AUM updated daily with ~1 day lag)
**Valid Data Range:** Starts January 11, 2024 (ETF launch date)
## What's New in Enhanced Edition
### Major Improvements
✅ **Advanced Analytics**: Moving averages with customizable periods
✅ **Smart Alerts**: 7 different alert conditions for comprehensive monitoring
✅ **Data Table**: Detailed per-ETF breakdown with daily flows, cumulative totals, AUM, and % contribution
✅ **Event Detection**: Automatic identification of record flows and new ATHs
✅ **Enhanced Visuals**: Dynamic color coding, optional fills, customizable transparency
✅ **Statistical Metrics**: Max/min flow detection, average calculations, trend analysis
✅ **Clean Display**: Data only shown from ETF launch date onwards
### UI/UX Enhancements
- Organized settings into 5 logical groups
- All visual elements independently toggleable
- Full color customization
- Professional dark-theme optimized palette
- Emoji markers for quick event recognition (🔥 🚀 ⚠️)
## Default Configuration
**Visible:**
- Cumulative net inflow line (purple, thin)
- Daily flow histogram (green/red bars)
- Event labels for significant days
**Hidden (Toggle On to See):**
- Moving averages
- Data table
- Area fills
## Tips for Best Results
1. **Combine with Price Analysis**: Use alongside BTC price charts for divergence detection
2. **Watch IBIT Dominance**: BlackRock's IBIT typically drives the majority of flows
3. **GBTC Matters**: Don't ignore GBTC outflows - they can offset new ETF inflows
4. **Set Relevant Alerts**: Adjust thresholds based on current market volatility
5. **Use MAs for Context**: Enable moving averages to smooth out noise in daily flows
6. **Check the Table**: When major events occur, open the data table to see which ETFs are driving flows
## Limitations
- AUM data updates with ~1 day delay
- Requires TradingView plan with access to financial data
- Most accurate on daily timeframe
- Does not account for creation/redemption mechanics directly
## Credits
Original concept: Bitcoin ETF flow tracking
Enhanced by: Comprehensive feature expansion including analytics, alerts, and advanced visualization
發行說明
V2.1# Dynamic Color System
## Smart Color-Changing Cumulative Line
The cumulative inflow line automatically changes color based on breakout detection, providing instant visual feedback on institutional capital flow trends.
開源腳本
秉持TradingView一貫精神,這個腳本的創作者將其設為開源,以便交易者檢視並驗證其功能。向作者致敬!您可以免費使用此腳本,但請注意,重新發佈代碼需遵守我們的社群規範。
免責聲明
這些資訊和出版物並非旨在提供,也不構成TradingView提供或認可的任何形式的財務、投資、交易或其他類型的建議或推薦。請閱讀使用條款以了解更多資訊。
開源腳本
秉持TradingView一貫精神,這個腳本的創作者將其設為開源,以便交易者檢視並驗證其功能。向作者致敬!您可以免費使用此腳本,但請注意,重新發佈代碼需遵守我們的社群規範。
免責聲明
這些資訊和出版物並非旨在提供,也不構成TradingView提供或認可的任何形式的財務、投資、交易或其他類型的建議或推薦。請閱讀使用條款以了解更多資訊。