OPEN-SOURCE SCRIPT
TRI - RSI & StochRSI Multi-Timeframe
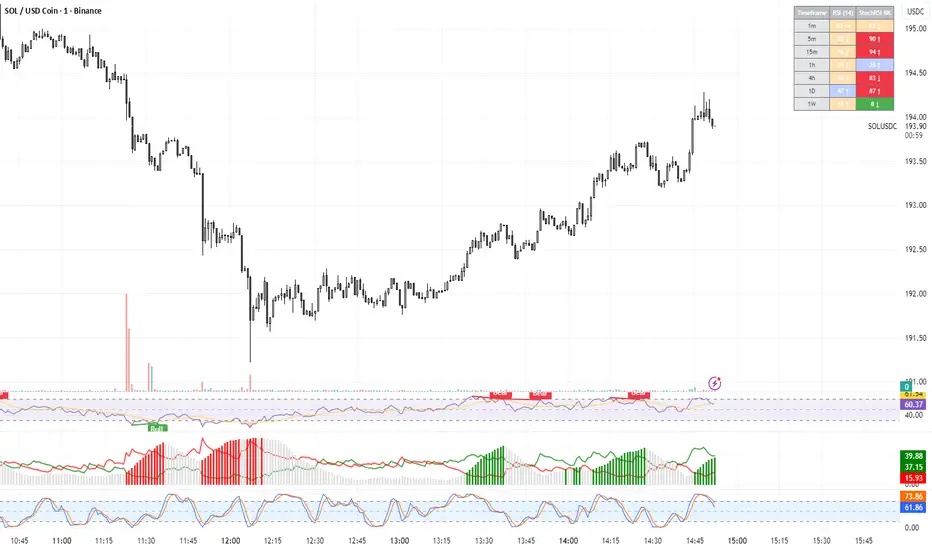
This indicator displays RSI and Stochastic RSI values across multiple timeframes
in a clear, color-coded table format.
FEATURES:
ALERTS:
in a clear, color-coded table format.
FEATURES:
- Monitors 7 timeframes: 1m, 5m, 15m, 1h, 4h, 1D, 1W
- Color-coded cells: Green (oversold), Red (overbought), Orange/Blue (neutral)
- Direction indicators for RSI trend
- StochRSI K/D comparison indicators
- Customizable oversold/overbought levels
- Configurable table position and size
ALERTS:
- RSI entering oversold/overbought zones
- StochRSI entering oversold/overbought zones
- StochRSI K/D crossovers (bullish and bearish)
開源腳本
秉持TradingView一貫精神,這個腳本的創作者將其設為開源,以便交易者檢視並驗證其功能。向作者致敬!您可以免費使用此腳本,但請注意,重新發佈代碼需遵守我們的社群規範。
免責聲明
這些資訊和出版物並非旨在提供,也不構成TradingView提供或認可的任何形式的財務、投資、交易或其他類型的建議或推薦。請閱讀使用條款以了解更多資訊。
開源腳本
秉持TradingView一貫精神,這個腳本的創作者將其設為開源,以便交易者檢視並驗證其功能。向作者致敬!您可以免費使用此腳本,但請注意,重新發佈代碼需遵守我們的社群規範。
免責聲明
這些資訊和出版物並非旨在提供,也不構成TradingView提供或認可的任何形式的財務、投資、交易或其他類型的建議或推薦。請閱讀使用條款以了解更多資訊。