PROTECTED SOURCE SCRIPT
Bottom Indicator
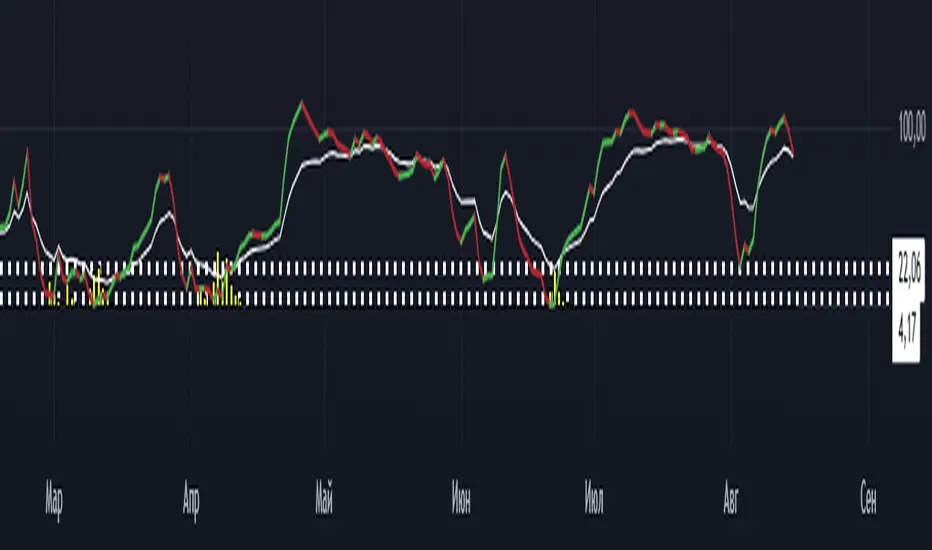
Indicator" identifies when the price is hitting local lows and large players might be stepping in (signaled by a yellow histogram). It overlays a KDJ oscillator and considers it a strong long signal if the purple (J) line is below 4, the white (K) line is below 22, and the yellow histogram is present. In other words, it spots a deeply oversold condition with big player activity as a prime buying opportunity.
受保護腳本
此腳本以閉源形式發佈。 不過,您可以自由使用,沒有任何限制 — 點擊此處了解更多。
免責聲明
這些資訊和出版物並非旨在提供,也不構成TradingView提供或認可的任何形式的財務、投資、交易或其他類型的建議或推薦。請閱讀使用條款以了解更多資訊。
受保護腳本
此腳本以閉源形式發佈。 不過,您可以自由使用,沒有任何限制 — 點擊此處了解更多。
免責聲明
這些資訊和出版物並非旨在提供,也不構成TradingView提供或認可的任何形式的財務、投資、交易或其他類型的建議或推薦。請閱讀使用條款以了解更多資訊。