INVITE-ONLY SCRIPT
Super and Simple Wave Trading
According to Dow theory, market has three movements, main movement, medium swing and short swing.
Dow theory is very easy to understand with multiple time frame, and probably we can say real market has more than three movements. For example, every time frame, whether it’s 1min, 5 min 30min or Day, Week, Month, has its own ups and downs, like waves in the ocean.
“Super and Simple Wave Trading” presents underlying reverse “price waves” in each time frame. With easy and simple plot, one can intuitively see when the price is above the ocean or under the water. This advanced algorithm is purely rely on price movement and it targets to filter out most noises with super fast response to the price movement.
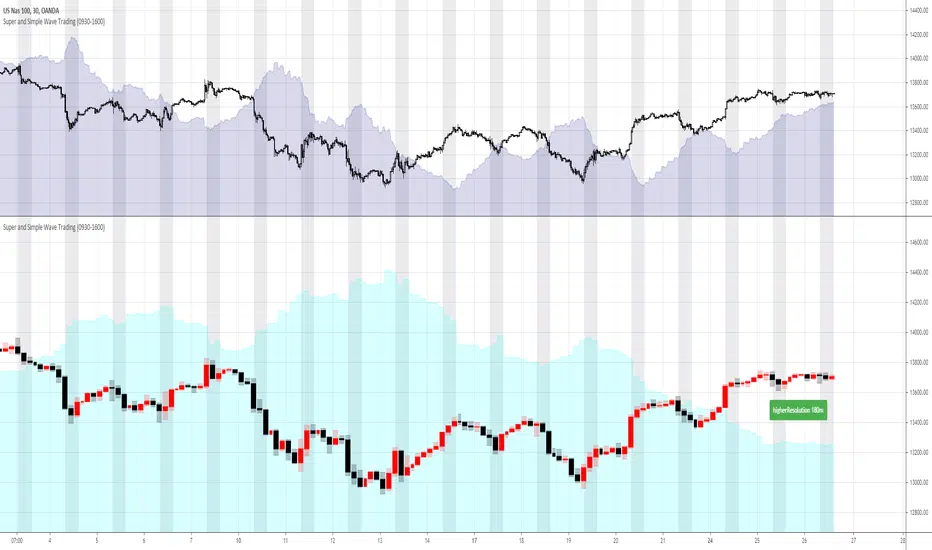
Besides plotting current resolution wave, “Super and Simple Wave Trading” also plots higher resolution bar and higher resolution wave under current resolution. For example, if current chart resolution is 1min, this indicator can plot 1min wave and 5min bar and wave.
When use this indicator, recommend plotting 2 panes on your screen, upper pane is current resolution candles with current resolution wave, the below pane is higher resolution bar and wave. So one can always get a very clear picture that how price is moving under different time frame. Recommend time frame chain in this indicator is 1m-5m-30m-180m-D-W.
The wave(shaded color area) is plotted under light(white) background, black background won’t show clearly
Some trading suggestions:
- While having a whole picture of higher or even higher resolution price wave, always focus on your comfortable current time frame, surf on it. Whether it’s stop loss or taking profit, it’s happening on current wave.
- Do not over trading is still a golden rule. Especially in a ranging market, like after hours stock market, the range is so tight that trading is not profitable. Although with this indicator, the loss is always minimal, however, remember the saying: “death by a thousand paper cuts”
- Stop loss is always strongly recommended. “Super and Simple Wave Trading” will directly show you the entry and when to exit, however, stop loss is always the last line of defense to protect you.
免責聲明
這些資訊和出版物並非旨在提供,也不構成TradingView提供或認可的任何形式的財務、投資、交易或其他類型的建議或推薦。請閱讀使用條款以了解更多資訊。