OPEN-SOURCE SCRIPT
[blackcat] L1 Swing Reversal
█ OVERVIEW
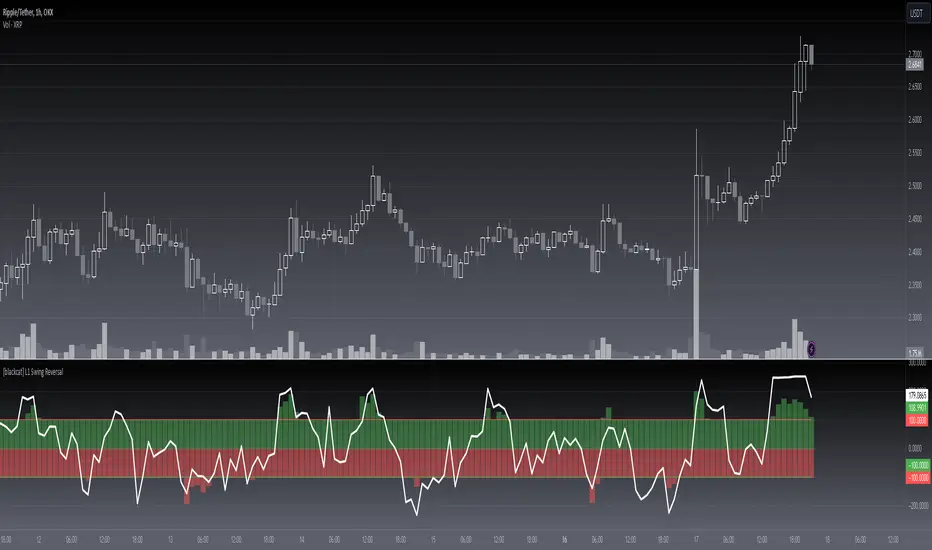
The script is an indicator that calculates and plots the L1 Swing Reversal, which involves smoothing price data and calculating a modified RSI to identify potential swing reversals in the market. It overlays columns representing the smoothed price data and a line for the adjusted RSI.
█ LOGICAL FRAMEWORK
The script begins by defining input parameters for customizable periods. It then calculates the typical price, derives components of the swing reversal indicator, smooths these components, and computes an adjusted RSI. The main sections include input parameter definitions, function definition, and plotting. The script flows data through calculations and logical operations to produce final plot values.
█ CUSTOM FUNCTIONS
Function: l1_swing_reversal
This function calculates the L1 Swing Reversal indicators based on high, low, close, and open prices, along with three periods. It computes a smoothed price component and an adjusted RSI.
Parameters:
• high: High prices of the asset.
• low: Low prices of the asset.
• close: Close prices of the asset.
• period_n: Period for the first component calculation.
• period_m: Period for standard deviation and moving average calculations.
• period_n1: Period for RSI calculation.
Return Values:
• cc1_column_red: Red column values for the first component.
• cc1_column_green: Green column values for the first component.
• rsi: Adjusted RSI values.
█ KEY POINTS AND TECHNIQUES
The script uses several key Pine Script features such as the sma (simple moving average), stdev (standard deviation), max, abs, and ema (exponential moving average) functions. It also demonstrates the use of conditional operators to cap the column values at -100 and 100. The script’s structure is clear and follows best practices by encapsulating the main logic within a function and using descriptive variable names.
█ EXTENDED KNOWLEDGE AND APPLICATIONS
Potential modifications could include adding more sophisticated reversal signals based on the RSI and column values, or enhancing the visualization with additional plot types. This script could be used in scenarios where traders are interested in identifying potential swing reversals using a combination of smoothed price data and momentum indicators. Related Pine Script concepts include using barssince for counting bars since a condition, crossover and crossunder for detecting trend changes, and hline for adding horizontal lines to the chart.
開源腳本
秉持TradingView一貫精神,這個腳本的創作者將其設為開源,以便交易者檢視並驗證其功能。向作者致敬!您可以免費使用此腳本,但請注意,重新發佈代碼需遵守我們的社群規範。
Avoid losing contact!Don't miss out! The first and most important thing to do is to join my Discord chat now! Click here to start your adventure: discord.com/invite/ZTGpQJq 防止失联,请立即行动,加入本猫聊天群: discord.com/invite/ZTGpQJq
免責聲明
這些資訊和出版物並非旨在提供,也不構成TradingView提供或認可的任何形式的財務、投資、交易或其他類型的建議或推薦。請閱讀使用條款以了解更多資訊。