OPEN-SOURCE SCRIPT
Weekday Colors with Time Highlighting by Nabojeet
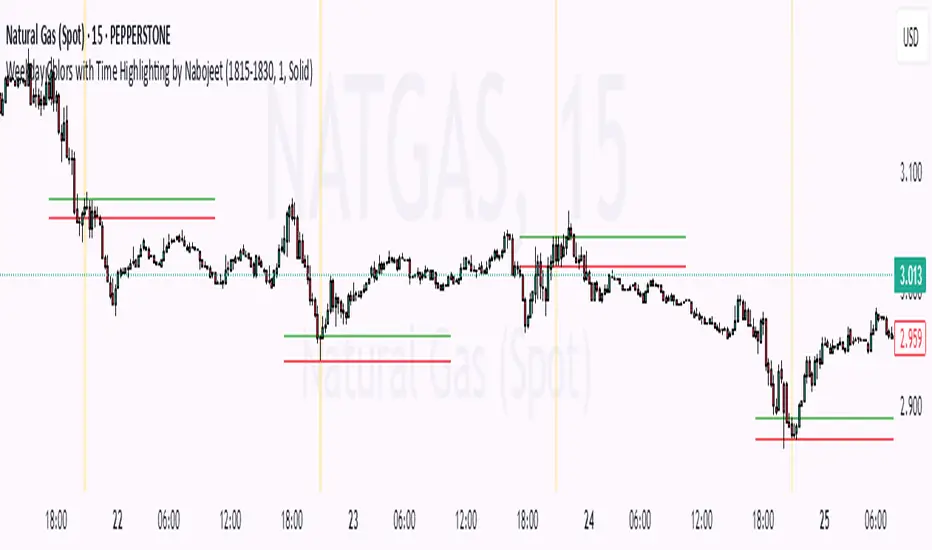
This script is a Pine Script (version 6) indicator called "Weekday Colors with Time Highlighting" designed for TradingView charts. It has several key functions:
1. **Weekday Color Coding**:
- Assigns different background colors to each trading day (Monday through Friday)
- Allows users to customize the color for each day
- Includes toggles to enable/disable colors for specific days
2. **Time Range Highlighting**:
- Highlights a specific time period (e.g., 18:15-18:30) on every trading day
- Uses a custom color that can be adjusted by the user
- The time range is specified in HHMM-HHMM format
3. **High/Low Line Drawing**:
- Automatically identifies the highest high and lowest low points within the specified time range
- Draws horizontal lines at these levels when the time period ends
- Lines extend forward in time to serve as support/resistance references
- Users can customize the line color, width, and style (solid, dotted, or dashed)
The script is organized into logical sections with input parameters grouped by function (Weekday Colors, Weekday Display, Time Highlighting, and Horizontal Lines). Each section's inputs are customizable through the indicator settings panel.
This indicator would be particularly useful for traders who:
- Want visual distinction between different trading days
- Focus on specific time periods each day (like market opens, closes, or specific sessions)
- Use intraday support/resistance levels from key time periods
- Want to quickly identify session highs and lows
The implementation resets tracking variables at the beginning of each new time range and draws the lines once the time period ends, ensuring accurate high/low marking for each day's specified time window.
Author - Nabojeet
開源腳本
秉持TradingView一貫精神,這個腳本的創作者將其設為開源,以便交易者檢視並驗證其功能。向作者致敬!您可以免費使用此腳本,但請注意,重新發佈代碼需遵守我們的社群規範。
免責聲明
這些資訊和出版物並非旨在提供,也不構成TradingView提供或認可的任何形式的財務、投資、交易或其他類型的建議或推薦。請閱讀使用條款以了解更多資訊。
開源腳本
秉持TradingView一貫精神,這個腳本的創作者將其設為開源,以便交易者檢視並驗證其功能。向作者致敬!您可以免費使用此腳本,但請注意,重新發佈代碼需遵守我們的社群規範。
免責聲明
這些資訊和出版物並非旨在提供,也不構成TradingView提供或認可的任何形式的財務、投資、交易或其他類型的建議或推薦。請閱讀使用條款以了解更多資訊。