OPEN-SOURCE SCRIPT
Indicator: Volatility Quality Index [VQI]
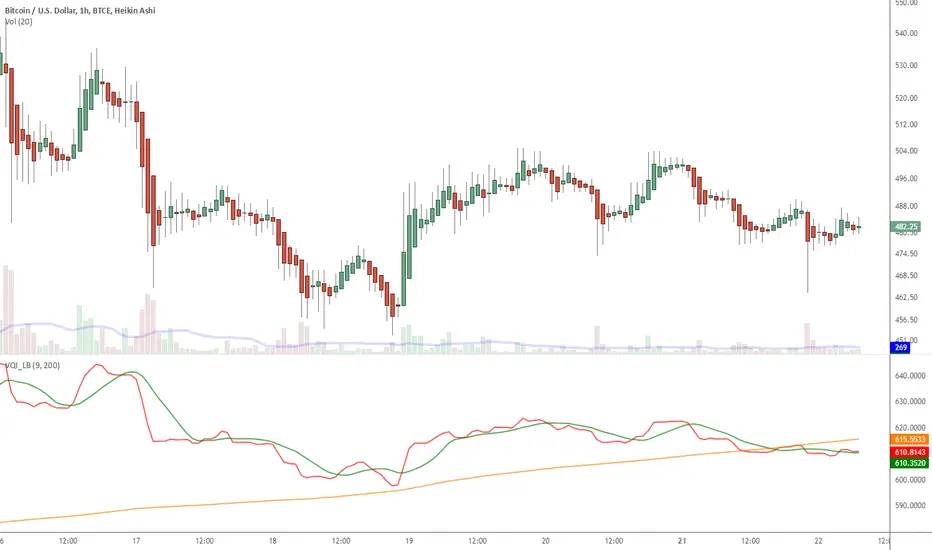
Volatility Quality Index (VQI), by Thomas Stridsman, points out the difference between bad and good volatility in order to identify better trade opportunities in the market.
This plots 3 lines:
- Red line is the VQI (actually, sum of VQI).
- Green line is the 9-period SMA of sum_of_VQI.
- Orange line is the 200-period SMA of sum_of_VQI.
Stridsman suggested to buy when VQI has increased in the previous 10 bars (use the SMAs) and sell when it has decreased in the previous 10 bars. IMO, use this with your other indicators as a confirmation signal.
More info: 3pips.com/volatility-quality-index-vq/
To use this indicator in your charts, click on "Share" button (top right on the chart). Click on "Make it mine" button on the dialog that pops up. Now, you will have a copy of this chart with the indicator's source code in it. Click on "{}" to open the source code of VQI_LB and save it to your custom scripts section.
開源腳本
本著TradingView的真正精神,此腳本的創建者將其開源,以便交易者可以查看和驗證其功能。向作者致敬!雖然您可以免費使用它,但請記住,重新發佈程式碼必須遵守我們的網站規則。
List of my free indicators: bit.ly/1LQaPK8
List of my indicators at Appstore: blog.tradingview.com/?p=970
List of my indicators at Appstore: blog.tradingview.com/?p=970
免責聲明
這些資訊和出版物並不意味著也不構成TradingView提供或認可的金融、投資、交易或其他類型的意見或建議。請在使用條款閱讀更多資訊。