OPEN-SOURCE SCRIPT
已更新 Open Lines (Daily/W/M/Q/Yearly)
Overview
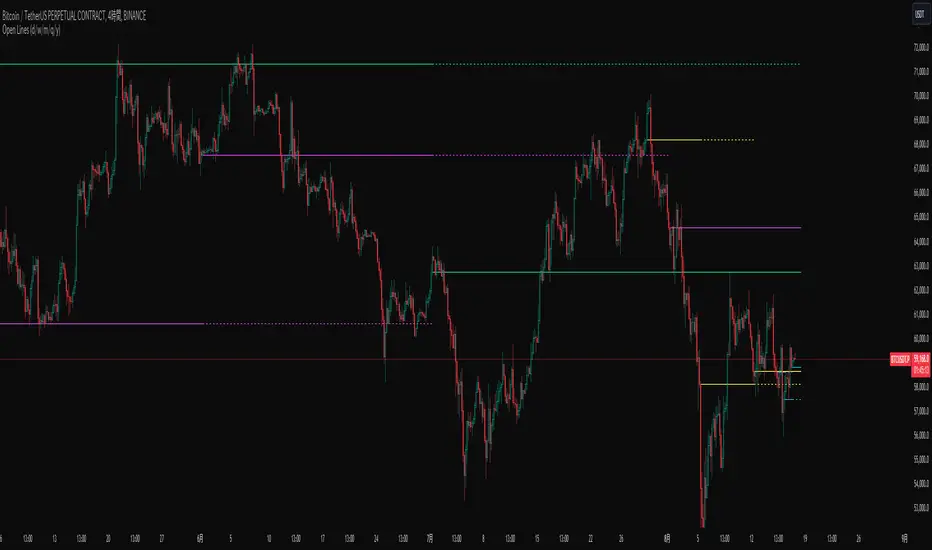
This script draws horizontal lines based on the opening prices of daily, weekly, monthly, quarterly, and yearly candles. A unique feature of this script is the ability to overlay lines from previous periods onto the current period. For example, it can draw the opening price line of the current month as well as the line from the previous month. This allows you to observe not only the battle between bullish and bearish candles of the current period but also the battle over whether the current candle engulfs the previous candle.
Settings
1. Common Settings for Daily to Yearly
Typically, an Extend value of 1 is sufficient, but you can increase this value if you want to observe engulfing patterns spanning multiple periods.
2. Style Settings
To differentiate between the current and past lines, the following settings are available:
Available styles are as follows:
3. Other Settings
This script draws horizontal lines based on the opening prices of daily, weekly, monthly, quarterly, and yearly candles. A unique feature of this script is the ability to overlay lines from previous periods onto the current period. For example, it can draw the opening price line of the current month as well as the line from the previous month. This allows you to observe not only the battle between bullish and bearish candles of the current period but also the battle over whether the current candle engulfs the previous candle.
Settings
1. Common Settings for Daily to Yearly
- On: Toggles the line drawing ON/OFF.
- Line: Sets how many periods back the line should be drawn from the current period.
- Extend: Sets how many periods into the future the lines from past candles should be extended.
Typically, an Extend value of 1 is sufficient, but you can increase this value if you want to observe engulfing patterns spanning multiple periods.
2. Style Settings
To differentiate between the current and past lines, the following settings are available:
- Current session line style: Sets the style for the line representing the opening price of the current candle.
- Next session line style: Sets the style for the line representing the opening price of past candles.
Available styles are as follows:
- sol: solid line
- dsh: dashed line
- dot: dotted line
3. Other Settings
- Allow overlapping of different session lines: By default, this setting prevents overlapping lines when candles from different periods open at the same time. Enabling this option allows lines from different periods, such as quarterly and monthly, to be drawn simultaneously if they overlap. By default, only the lines from the higher time frame are drawn.
發行說明
Two new features have been added to enhance functionality:1. Session-based Line Drawing:
- You can now draw lines based on the opening price of any specified intraday session.
2. Labels:
- Labels are now drawn at each opening price.
- These labels are aligned to the right side of the screen.
發行說明
Adjusting input properties開源腳本
秉持TradingView一貫精神,這個腳本的創作者將其設為開源,以便交易者檢視並驗證其功能。向作者致敬!您可以免費使用此腳本,但請注意,重新發佈代碼需遵守我們的社群規範。
免責聲明
這些資訊和出版物並非旨在提供,也不構成TradingView提供或認可的任何形式的財務、投資、交易或其他類型的建議或推薦。請閱讀使用條款以了解更多資訊。
免責聲明
這些資訊和出版物並非旨在提供,也不構成TradingView提供或認可的任何形式的財務、投資、交易或其他類型的建議或推薦。請閱讀使用條款以了解更多資訊。