OPEN-SOURCE SCRIPT
Market Structure
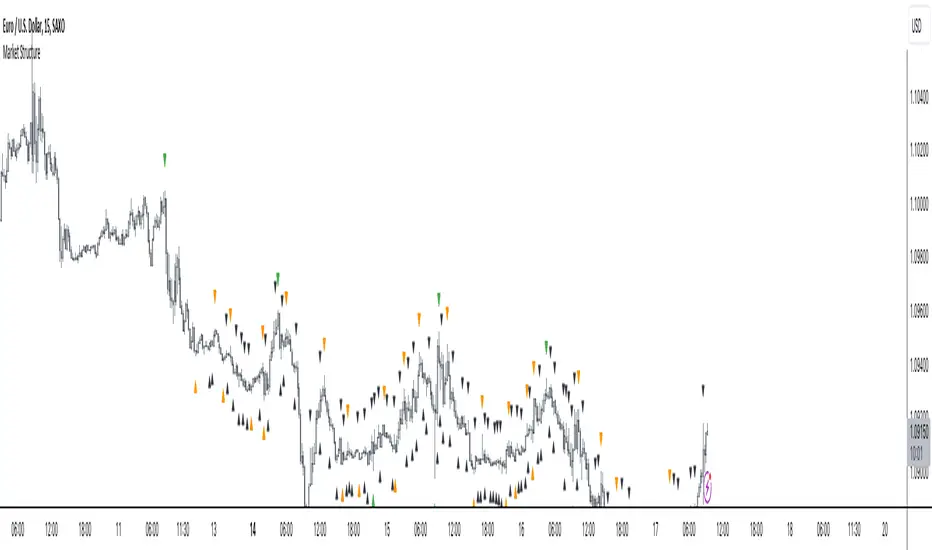
- Intermediate Term Low (ITL): A point on a price chart where the price reaches a relatively lower level compared to the surrounding price points within an intermediate time frame.
- Intermediate Term High (ITH): A point on a price chart where the price reaches a relatively higher level compared to the surrounding price points within an intermediate time frame.
- Long Term Low (LTL): An Intermediate Term Low (ITL) that has higher Intermediate Term Lows (ITL) on both sides of it, indicating a potential significant reversal point and considered a long term trend change.
- Long Term High (LTH): An Intermediate Term High (ITH) that has lower Intermediate Term Highs (ITH) on both sides of it, indicating a potential significant reversal point and considered a long term trend change
The script designed to automatically identify these patterns on a price chart. It categorizes ITH/L and LTH/L points for easy recognition of the market structure and potential pivot points. Traders and analysts often use such patterns and pivot points to make decisions about entering or exiting positions in the market.
Please note that while these concepts are based on certain patterns observed in historical price data, trading and investing in financial markets can be complex and risky. It's important to have a solid understanding of technical analysis, risk management, and market dynamics before making trading decisions.
開源腳本
秉持TradingView一貫精神,這個腳本的創作者將其設為開源,以便交易者檢視並驗證其功能。向作者致敬!您可以免費使用此腳本,但請注意,重新發佈代碼需遵守我們的社群規範。
免責聲明
這些資訊和出版物並非旨在提供,也不構成TradingView提供或認可的任何形式的財務、投資、交易或其他類型的建議或推薦。請閱讀使用條款以了解更多資訊。
開源腳本
秉持TradingView一貫精神,這個腳本的創作者將其設為開源,以便交易者檢視並驗證其功能。向作者致敬!您可以免費使用此腳本,但請注意,重新發佈代碼需遵守我們的社群規範。
免責聲明
這些資訊和出版物並非旨在提供,也不構成TradingView提供或認可的任何形式的財務、投資、交易或其他類型的建議或推薦。請閱讀使用條款以了解更多資訊。