OPEN-SOURCE SCRIPT
已更新 Decoding the Volume of candles
The indicator is designed for traders who are more interested in market structures and price action using volumes. Volume analysis can help traders build a clearer understanding of zones of buyer and seller interest, as well as liquidity gathering points (traders' stop levels).
Key Features:
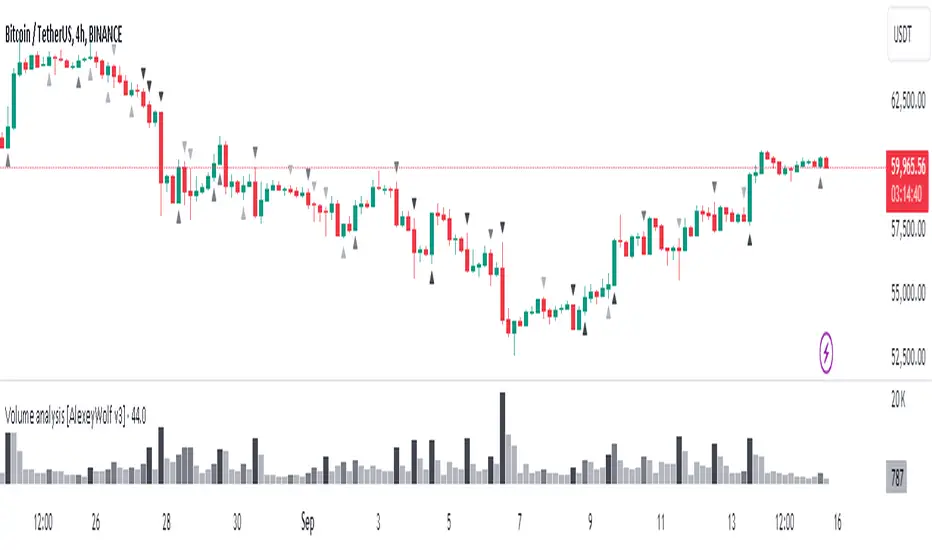
The indicator visualizes on the chart the volumes selected according to the trader's chosen settings.
The indicator highlights candle volumes in selected colors, where the volume is greater individually than the volumes of the trader's chosen number of preceding candles. Or the volume that is greater than the sum of volumes of the trader's chosen number of preceding candles.
The indicator mark selected volumes on the chart based on the type of candle. The candle type (1, 2, or 3) is determined by its result (close) relative to other candles.
Volume marked for a type 3 candle draws the trader’s attention to the lack of results from the applied volume compared to the previous candle, indicating potential weakness of the candle’s owner. This is especially important in buyer or seller context areas.
Volume marked for a type 2 candle highlights the presence of results from the applied volume but only relative to the previous candle. In buyer or seller context areas, this can signal weakness of the candle’s owner.
Volume marked for a type 1 candle signals a strong result from the applied volume, indicating potential strength of the candle’s owner.
The marking of volumes can be displayed either on the main chart or on the volume chart, depending on the trader's preference. Colors and symbols for marking can be customized on the Style tab.
Volumes can be filtered on both the volume chart and the main chart according to their marking. This feature can be useful, for example, for traders who don’t work with signs of buyer or seller weakness. In such cases, they can filter out volumes only for type 1 candles.
Good luck exploring the impact of volumes on price behavior!
Key Features:
The indicator visualizes on the chart the volumes selected according to the trader's chosen settings.
The indicator highlights candle volumes in selected colors, where the volume is greater individually than the volumes of the trader's chosen number of preceding candles. Or the volume that is greater than the sum of volumes of the trader's chosen number of preceding candles.
The indicator mark selected volumes on the chart based on the type of candle. The candle type (1, 2, or 3) is determined by its result (close) relative to other candles.
Volume marked for a type 3 candle draws the trader’s attention to the lack of results from the applied volume compared to the previous candle, indicating potential weakness of the candle’s owner. This is especially important in buyer or seller context areas.
Volume marked for a type 2 candle highlights the presence of results from the applied volume but only relative to the previous candle. In buyer or seller context areas, this can signal weakness of the candle’s owner.
Volume marked for a type 1 candle signals a strong result from the applied volume, indicating potential strength of the candle’s owner.
The marking of volumes can be displayed either on the main chart or on the volume chart, depending on the trader's preference. Colors and symbols for marking can be customized on the Style tab.
Volumes can be filtered on both the volume chart and the main chart according to their marking. This feature can be useful, for example, for traders who don’t work with signs of buyer or seller weakness. In such cases, they can filter out volumes only for type 1 candles.
Good luck exploring the impact of volumes on price behavior!
發行說明
Explanations of script elements發行說明
Added the ability to set up alerts for volume formation according to the trader's selected settings. If you configure alerts (select the indicator when adding an alert), they will trigger for candle types specified in the Candle type settings.開源腳本
秉持TradingView一貫精神,這個腳本的創作者將其設為開源,以便交易者檢視並驗證其功能。向作者致敬!您可以免費使用此腳本,但請注意,重新發佈代碼需遵守我們的社群規範。
Рыночные сценарии, инструкция к индикатору, практические примеры — t.me/ialogic
Market scenarios, indicator guide, practical examples — t.me/initiativeanalysis
Clarity on the Chart. Smart Trading Decisions
Market scenarios, indicator guide, practical examples — t.me/initiativeanalysis
Clarity on the Chart. Smart Trading Decisions
免責聲明
這些資訊和出版物並非旨在提供,也不構成TradingView提供或認可的任何形式的財務、投資、交易或其他類型的建議或推薦。請閱讀使用條款以了解更多資訊。
開源腳本
秉持TradingView一貫精神,這個腳本的創作者將其設為開源,以便交易者檢視並驗證其功能。向作者致敬!您可以免費使用此腳本,但請注意,重新發佈代碼需遵守我們的社群規範。
Рыночные сценарии, инструкция к индикатору, практические примеры — t.me/ialogic
Market scenarios, indicator guide, practical examples — t.me/initiativeanalysis
Clarity on the Chart. Smart Trading Decisions
Market scenarios, indicator guide, practical examples — t.me/initiativeanalysis
Clarity on the Chart. Smart Trading Decisions
免責聲明
這些資訊和出版物並非旨在提供,也不構成TradingView提供或認可的任何形式的財務、投資、交易或其他類型的建議或推薦。請閱讀使用條款以了解更多資訊。