OPEN-SOURCE SCRIPT
已更新 Fractal Wave Marker

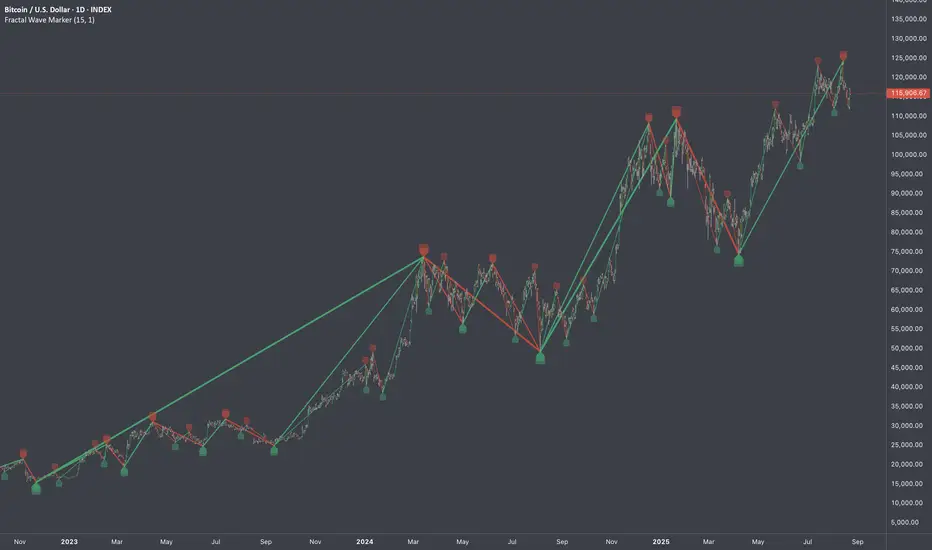
Fractal Wave Marker is an indicator that processes relative extremes of fluctuating prices within 2 periodical aspects. The special labeling system detects and visually marks multi-scale turning points, letting you visualize fractal echoes within unfolding cycles dynamically.
What This Indicator Does
Inspired by the Fractal Market Hypothesis, this script visualizes the principle that market behavior repeats across time scales, revealing structured narrative of "random walk". This inherent sequencing ensures fractal consistency across timeframes. "Fractal echoes" demonstrate how smaller price swings can proportionally mirror larger ones in both structure and timing, allowing traders to anticipate movements by recursive patterns. Cycle Transitions highlight critical inflection points where minor pivots flip polarity such as a series of lower highs progress into higher highs—signaling the birth of a new macro trend. A dense dense clusters of swing points can indicate Liquidity Zones, acting as footprints of institutional accumulation or distribution where price action validates supply and demand imbalances.
Visualization of nested cycles within macro trend anchors - a main feature specifically designed for the chartists who prioritize working with complex wave oscillations their analysis.
What This Indicator Does
- Identifies major and minor swing highs/lows based on adjustable period.
- Uses Phi in power exponent to compute a higher-degree swing filter.
- Labels of higher degree appear only after confirmed base swings — no phantom levels, no hindsight bias. What you see is what the market has validated.
- Swing points unfold in a structured, alternating rhythm. No two consecutive pivots share the same hierarchical degree!
Inspired by the Fractal Market Hypothesis, this script visualizes the principle that market behavior repeats across time scales, revealing structured narrative of "random walk". This inherent sequencing ensures fractal consistency across timeframes. "Fractal echoes" demonstrate how smaller price swings can proportionally mirror larger ones in both structure and timing, allowing traders to anticipate movements by recursive patterns. Cycle Transitions highlight critical inflection points where minor pivots flip polarity such as a series of lower highs progress into higher highs—signaling the birth of a new macro trend. A dense dense clusters of swing points can indicate Liquidity Zones, acting as footprints of institutional accumulation or distribution where price action validates supply and demand imbalances.
Visualization of nested cycles within macro trend anchors - a main feature specifically designed for the chartists who prioritize working with complex wave oscillations their analysis.
發行說明
Important Updates- ✅ Fixed Repainting Issue while preserving alternating swing logicLabels now appear only after directional changes, ensuring structurally valid and non-repainting swings.
- ✅ Added “Phi Power Scaling” input to control the proportional scaling between base and nested swings.
This enables dynamic fractal nesting based on power exponents of the Golden Ratio.
◇ Chronological capture of alternating swings ensures that each label marks a completed wave — not just a local pivot. The Fractal Wave Marker tracks oscillations similarly to ZigZag logic, but with an added structural filter. Unlike traditional pivot indicators that tag every local high or low, this tool labels only confirmed wave extremes, thanks to its built-in swing memory and direction-aware logic.
❖ Targeting Structure
- Period — the primary control for tuning sensitivity to market structure.
Adjusting this defines the resolution of base swings. (Partially impacts higher-degree markets.)
• Lower values → more reactive swings
• Higher values → broader, more dominant structure - Phi Power Scaling — determines the temporal separation between nested fractal waves. This input applies power exponents of Phi to the base period, aligning with natural structural growth seen in fractal systems.
• 1–2: Captures nearby, short-term “fragmental shifts”
• 3–4: Targets dominant higher-order wave patterns
This is a stable version of the analytical tool designed to interpret the geometric narrative of price flow, emphasizing the visual hierarchy between swings of different fractal scales.
發行說明
Integrated 3rd window for processing price extremes at a broader time scale. New visual marking brings more clarity to the concept of nested waves.發行說明
Minor changes:- Created a separate function for the initial stage of multi-scale swing detection.
- Revised and compressed the code to avoid unnecessary lines at various places.
發行說明
Redesigned labeling to its original look with more reasonable gradual sizing. 發行說明
Some fixes:- Wave hierarchy reflected in line width.
- Removed some elements from prev version of code to reduce memory usage.
發行說明
Minor changes to improve pattern readability.發行說明
- Updating the indicator to its appropriate design based on personal experience (extensive use).
開源腳本
秉持TradingView一貫精神,這個腳本的創作者將其設為開源,以便交易者檢視並驗證其功能。向作者致敬!您可以免費使用此腳本,但請注意,重新發佈代碼需遵守我們的社群規範。
Unlock exclusive tools: fractlab.com
ᴀʟʟ ᴄᴏɴᴛᴇɴᴛ ᴘʀᴏᴠɪᴅᴇᴅ ʙʏ ꜰʀᴀᴄᴛʟᴀʙ ɪꜱ ɪɴᴛᴇɴᴅᴇᴅ ꜰᴏʀ ɪɴꜰᴏʀᴍᴀᴛɪᴏɴᴀʟ ᴀɴᴅ ᴇᴅᴜᴄᴀᴛɪᴏɴᴀʟ ᴘᴜʀᴘᴏꜱᴇꜱ ᴏɴʟʏ.
ᴘᴀꜱᴛ ᴘᴇʀꜰᴏʀᴍᴀɴᴄᴇ ɪꜱ ɴᴏᴛ ɪɴᴅɪᴄᴀᴛɪᴠᴇ ᴏꜰ ꜰᴜᴛᴜʀᴇ ʀᴇꜱᴜʟᴛꜱ.
ᴀʟʟ ᴄᴏɴᴛᴇɴᴛ ᴘʀᴏᴠɪᴅᴇᴅ ʙʏ ꜰʀᴀᴄᴛʟᴀʙ ɪꜱ ɪɴᴛᴇɴᴅᴇᴅ ꜰᴏʀ ɪɴꜰᴏʀᴍᴀᴛɪᴏɴᴀʟ ᴀɴᴅ ᴇᴅᴜᴄᴀᴛɪᴏɴᴀʟ ᴘᴜʀᴘᴏꜱᴇꜱ ᴏɴʟʏ.
ᴘᴀꜱᴛ ᴘᴇʀꜰᴏʀᴍᴀɴᴄᴇ ɪꜱ ɴᴏᴛ ɪɴᴅɪᴄᴀᴛɪᴠᴇ ᴏꜰ ꜰᴜᴛᴜʀᴇ ʀᴇꜱᴜʟᴛꜱ.
免責聲明
這些資訊和出版物並非旨在提供,也不構成TradingView提供或認可的任何形式的財務、投資、交易或其他類型的建議或推薦。請閱讀使用條款以了解更多資訊。