PROTECTED SOURCE SCRIPT
已更新 Ultimate Average 3.0
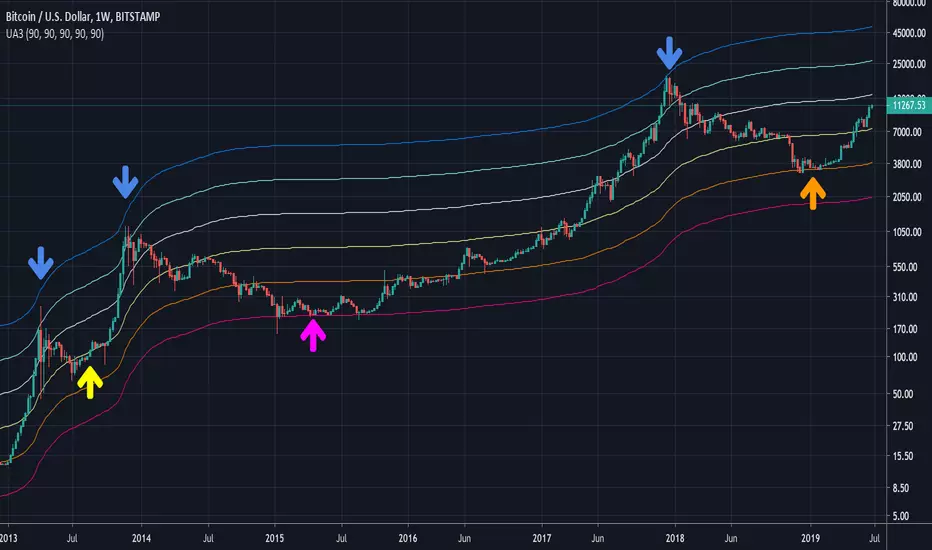
Purple = Actual average price over total timeframe.
Other lines are factors above the actual average.
A pattern emerges where the purple is hit, then a parabolic rise to the blue top, then the a drawback down to the orange, then parabolic, then drawback to yellow, then parabolic to blue, then a reset back to the purple line.
Other lines are factors above the actual average.
A pattern emerges where the purple is hit, then a parabolic rise to the blue top, then the a drawback down to the orange, then parabolic, then drawback to yellow, then parabolic to blue, then a reset back to the purple line.
發行說明
updates timescale automation受保護腳本
此腳本以閉源形式發佈。 不過,您可以自由且不受任何限制地使用它 — 在此處了解更多資訊。
免責聲明
這些資訊和出版物並不意味著也不構成TradingView提供或認可的金融、投資、交易或其他類型的意見或建議。請在使用條款閱讀更多資訊。
受保護腳本
此腳本以閉源形式發佈。 不過,您可以自由且不受任何限制地使用它 — 在此處了解更多資訊。
免責聲明
這些資訊和出版物並不意味著也不構成TradingView提供或認可的金融、投資、交易或其他類型的意見或建議。請在使用條款閱讀更多資訊。