OPEN-SOURCE SCRIPT
已更新 Supply and Demand Based Pattern [RH]
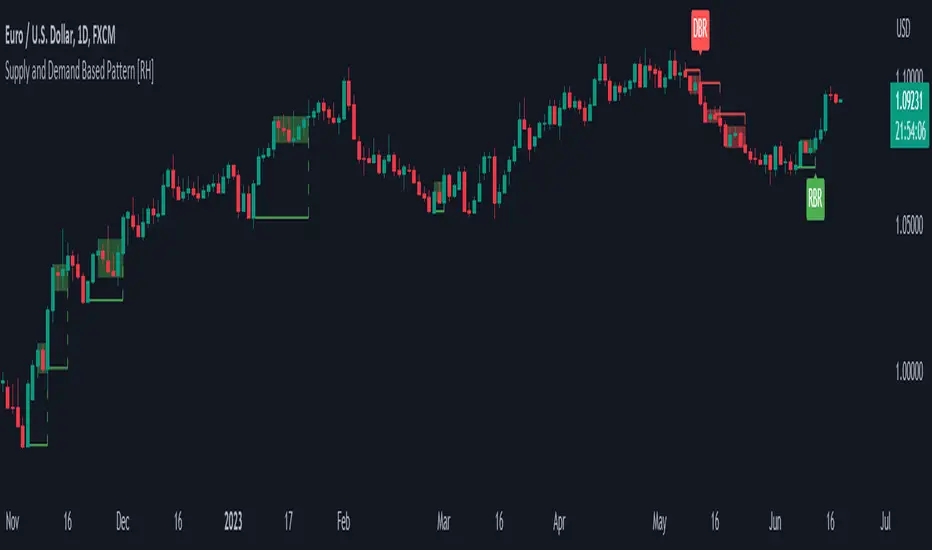
This indicator focuses on detecting RBR and DBD patterns, which signify periods of increased momentum and potential continuation or reversal of the prevailing trend.
The RBR pattern consists of a rally (upward movement), followed by a base (consolidation or retracement), and then another rally. It suggests that the upward momentum may persist and provide trading opportunities.
On the other hand, the DBD pattern comprises a drop (downward movement), followed by a base, and then another drop. It indicates that the downward momentum might continue, offering potential shorting opportunities.
Bullish(RBR) example:

Bearish(DBD) example:

1. The bullish (RBR) and bearish (DBD) patterns share the same underlying logic, only differing in their directionality.
2. For both RBR and DBD patterns, the first rise/drop can consist of one or multiple candles. However, in the case of multiple candles, all candles must exhibit a bullish nature for RBR and a bearish nature for DBD.
Example:

3. It is a prerequisite for the first rise/drop to include at least one candle with a defined percentage of health, as determined by the user.
4. The base, following the first rise/drop, may comprise one or multiple candles.
Example:

5. To maintain consistency, the base is not allowed to retrace beyond 80%, although this value can be adjusted by the user.
6. Similar to the first rise/drop, the second rise/drop in both RBR and DBD patterns can consist of one or multiple candles. However, all candles within this phase must demonstrate a bullish nature for RBR and a bearish nature for DBD.
7. Confirmation of the bullish (RBR) pattern occurs when a candle closes above the high of the first rise. Conversely, the bearish (DBD) pattern is confirmed when a candle closes below the low of the first drop.
Example:

Alerts can be set for all bullish and bearish pattern or for the first pattern in the range of similar pattern.
The RBR pattern consists of a rally (upward movement), followed by a base (consolidation or retracement), and then another rally. It suggests that the upward momentum may persist and provide trading opportunities.
On the other hand, the DBD pattern comprises a drop (downward movement), followed by a base, and then another drop. It indicates that the downward momentum might continue, offering potential shorting opportunities.
Bullish(RBR) example:
Bearish(DBD) example:
1. The bullish (RBR) and bearish (DBD) patterns share the same underlying logic, only differing in their directionality.
2. For both RBR and DBD patterns, the first rise/drop can consist of one or multiple candles. However, in the case of multiple candles, all candles must exhibit a bullish nature for RBR and a bearish nature for DBD.
Example:
3. It is a prerequisite for the first rise/drop to include at least one candle with a defined percentage of health, as determined by the user.
4. The base, following the first rise/drop, may comprise one or multiple candles.
Example:
5. To maintain consistency, the base is not allowed to retrace beyond 80%, although this value can be adjusted by the user.
6. Similar to the first rise/drop, the second rise/drop in both RBR and DBD patterns can consist of one or multiple candles. However, all candles within this phase must demonstrate a bullish nature for RBR and a bearish nature for DBD.
7. Confirmation of the bullish (RBR) pattern occurs when a candle closes above the high of the first rise. Conversely, the bearish (DBD) pattern is confirmed when a candle closes below the low of the first drop.
Example:
Alerts can be set for all bullish and bearish pattern or for the first pattern in the range of similar pattern.
發行說明
Pattern's name fix.開源腳本
秉持TradingView一貫精神,這個腳本的創作者將其設為開源,以便交易者檢視並驗證其功能。向作者致敬!您可以免費使用此腳本,但請注意,重新發佈代碼需遵守我們的社群規範。
免責聲明
這些資訊和出版物並非旨在提供,也不構成TradingView提供或認可的任何形式的財務、投資、交易或其他類型的建議或推薦。請閱讀使用條款以了解更多資訊。
開源腳本
秉持TradingView一貫精神,這個腳本的創作者將其設為開源,以便交易者檢視並驗證其功能。向作者致敬!您可以免費使用此腳本,但請注意,重新發佈代碼需遵守我們的社群規範。
免責聲明
這些資訊和出版物並非旨在提供,也不構成TradingView提供或認可的任何形式的財務、投資、交易或其他類型的建議或推薦。請閱讀使用條款以了解更多資訊。