OPEN-SOURCE SCRIPT
已更新 [blackcat] L1 Fibonacci VWAP RSI Indicator
Level: 1
Background
Ingo Bucher proposed "Fibonacci RSI" in March,2003. It describes the advantages of considering Fibonacci retracement levels for use with the classic RSI indicator. Bucher reviews six charts, each displaying Fibonacci retracement levels for the RSI associated with each chart. The pine code given here will allow you to automatically recreate these charts for any security available in Tradingview. BTW, i enhanced it by changing RSI into VWAP RSI with hl2.
Function
For this Fib VWAP RSI indicator, it also applicable for original Bucher's fib concept. Bucher calculated his retracement levels by picking the RSI high and low for a given time window. In his examples, these were generally six months to a year's worth of data. Once the high and low were picked, he calculated retracement levels based on the well-known Fibonacci numbers (23.6%, 38.2%, 50%, 61.8%). This script here does the same thing. I use a "LookbackLength" (default: 400 bars), which represents a sliding data window that is used to determine the VWAP RSI high and low. The second input value controls the VWAP RSI period (default: 14 bars). The next three inputs select the retracement levels.
A total of eight different lines need to be drawn: the RSI itself, the 50% line, two retracements above the 50% point, two retracements below, and the zero and 100% lines. Pine script will create four plotlines per indicator, so I advise inserting the Fibonacci RSI twice. The first time it is inserted, leave the PlotRSI input with its default value, true. True tells pine script to plot the VWAP RSI itself. The second copy should have the input "Plot RSI" set to false. This will put the 50% line on your chart.
Inputs
LookbackLength --> Look Back Length.
RSILength --> RSI Length.
Fib1 and Fib2 --> Fibonacci lengths.
Key Signal
RawVWAPRSI --> Raw VWAP RSI output signal
Remarks
This is a Level 1 free and open source indicator.
Feedbacks are appreciated.
發行說明
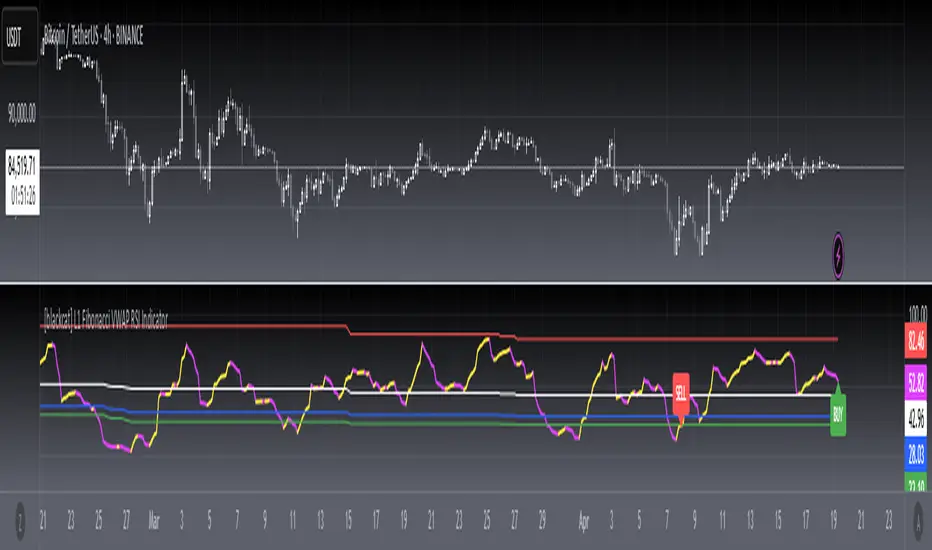
OVERVIEW The [blackcat] L1 Fibonacci VWAP RSI Indicator is designed to provide traders with advanced insights into market trends and potential trading opportunities using Volume Weighted Average Price (VWAP) combined with Relative Strength Index (RSI). This indicator calculates various Fibonacci retracement levels based on historical data, helping users identify critical support and resistance zones 📊✅.
It plots Raw VWAP RSI values along with three customizable Fibonacci levels, allowing traders to visualize key price points and make informed decisions. The script also includes alert conditions for crossovers between the Raw VWAP RSI and Fibonacci levels, enhancing real-time decision-making capabilities 🚨💡.
INPUT PARAMETERS
The following parameters can be adjusted within the script settings:
Lookback Period: Defines the number of bars used to calculate the highest and lowest RSI values over a specified period.
Default: 400
RSI Period: Specifies the time frame for calculating the RSI.
Default: 14
Fibonacci Levels:
Level 1: First Fibonacci retracement level.
Default: 23.6
Level 2: Second Fibonacci retracement level.
Default: 31.1
Level 3: Third Fibonacci retracement level.
Default: 100
FEATURES
Customizable Fibonacci Retracement Levels: Users can adjust the Fibonacci levels according to their trading strategy.
Dynamic Plot Colors: The plot colors change dynamically based on whether the current value is higher or lower than the previous one.
Alert Conditions: Provides alerts when the Raw VWAP RSI crosses above or below any of the three Fibonacci levels.
Buy/Sell Labels: Displays "BUY" and "SELL" labels at the respective crossover points for easy visual identification.
HOW TO USE
Add the script to your TradingView chart by searching for "L1 Fibonacci VWAP RSI" in the Pine Editor or through the community scripts section.
Adjust the input parameters as needed to fit your specific trading requirements.
Observe the plotted lines representing the Raw VWAP RSI and the three Fibonacci levels.
Utilize the alert conditions to receive notifications when significant crossovers occur.
Make trading decisions based on the visualized support/resistance levels and the dynamic plot colors indicating trend changes.
LIMITATIONS
The accuracy of the indicator depends heavily on the chosen lookback period and RSI settings.
It may not perform well in highly volatile markets where rapid price movements can distort VWAP calculations.
Always use this indicator alongside other technical analysis tools for better confirmation of signals.
NOTES
This script is intended for educational purposes and should not be considered financial advice. Traders are encouraged to backtest strategies thoroughly before applying them to live trading environments 📈🔍.
開源腳本
秉持TradingView一貫精神,這個腳本的創作者將其設為開源,以便交易者檢視並驗證其功能。向作者致敬!您可以免費使用此腳本,但請注意,重新發佈代碼需遵守我們的社群規範。
Avoid losing contact!Don't miss out! The first and most important thing to do is to join my Discord chat now! Click here to start your adventure: discord.com/invite/ZTGpQJq 防止失联,请立即行动,加入本猫聊天群: discord.com/invite/ZTGpQJq
免責聲明
這些資訊和出版物並非旨在提供,也不構成TradingView提供或認可的任何形式的財務、投資、交易或其他類型的建議或推薦。請閱讀使用條款以了解更多資訊。