OPEN-SOURCE SCRIPT
SuperTrend'ed Fibos - DolphinTradeBot
- Overwiev
This indicator aims to assist in taking trades at relatively low price levels in the direction of the main trend and capturing profits at potential reversal points.
What is it for !
The indicator simply performs its calculations by using two multitimeframe SuperTrend indicators, Fibonacci levels, and pivot points. The reason for using MTF in both SuperTrend indicators is that the lengths of the levels are relatively limited, so it allows for a more detailed analysis on lower timeframes.
- How is it work
When both the HTF SuperTrend and the main SuperTrend indicators are in the same direction,
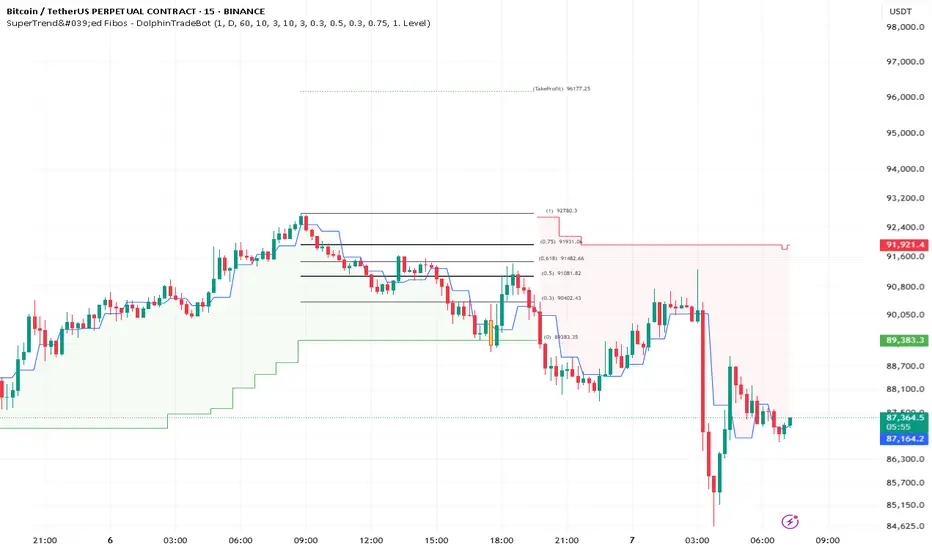
For Uptrend:
Once the main SuperTrend line is violated it barcolor and draws the basic Fibonacci levels between the pivot high point and the SuperTrend line within the trend region . The TakeProfit level is drawn at a distance multiplied by the TakeProfit Multiplier, between the lowest and highest points of the level. When the main trend reverses or the TakeProfit level is violated, it stops drawing.
For Downtrend:
Once the main SuperTrend line is violated it barcolor and draws the basic Fibonacci levels between the pivot low point and the SuperTrend line within the trend region . The TakeProfit level is drawn at a distance multiplied by the TakeProfit Multiplier, between the lowest and highest points of the level. When the main trend reverses or the TakeProfit level is violated, it stops drawing.
How to Use:
To prevent the line thickness from being displayed on the screen, the indicator shows the direction of the HTF SuperTrend indicator by coloring the background. In the settings section, you can adjust:
TakeProfit Multiplier
Fibonacci line colors
HTF SuperTrend activation
HTF SuperTrend settings
Main SuperTrend settings
Fibonacci levels
Custom alert activation
Custom alert level
- Alarm Section
By default, the indicator gives an alert when a level is formed or violated. Additionally, if you want to set an alert for a specific level, you can activate the Custom Alert option and choose your desired level.
開源腳本
秉持TradingView一貫精神,這個腳本的創作者將其設為開源,以便交易者檢視並驗證其功能。向作者致敬!您可以免費使用此腳本,但請注意,重新發佈代碼需遵守我們的社群規範。
免責聲明
這些資訊和出版物並非旨在提供,也不構成TradingView提供或認可的任何形式的財務、投資、交易或其他類型的建議或推薦。請閱讀使用條款以了解更多資訊。
開源腳本
秉持TradingView一貫精神,這個腳本的創作者將其設為開源,以便交易者檢視並驗證其功能。向作者致敬!您可以免費使用此腳本,但請注意,重新發佈代碼需遵守我們的社群規範。
免責聲明
這些資訊和出版物並非旨在提供,也不構成TradingView提供或認可的任何形式的財務、投資、交易或其他類型的建議或推薦。請閱讀使用條款以了解更多資訊。