OPEN-SOURCE SCRIPT
已更新 Volume Zone Oscillator by [VanHelsig]
Volume Zone Oscillator
How volume zone oscillator work:
Like other VZO it uses the same principle of calculation Volume direction divided on total volume and then scaled to 100 and -100.
When we have positive momentum close > close[loockback] we have value of positive Volume, other way we have -volume negative one. <- this called a volume direction
Total volume is simply moving average with source of volume
And then MA with source of volume direction divided on MA of total colume and scaled it from 100 to -100
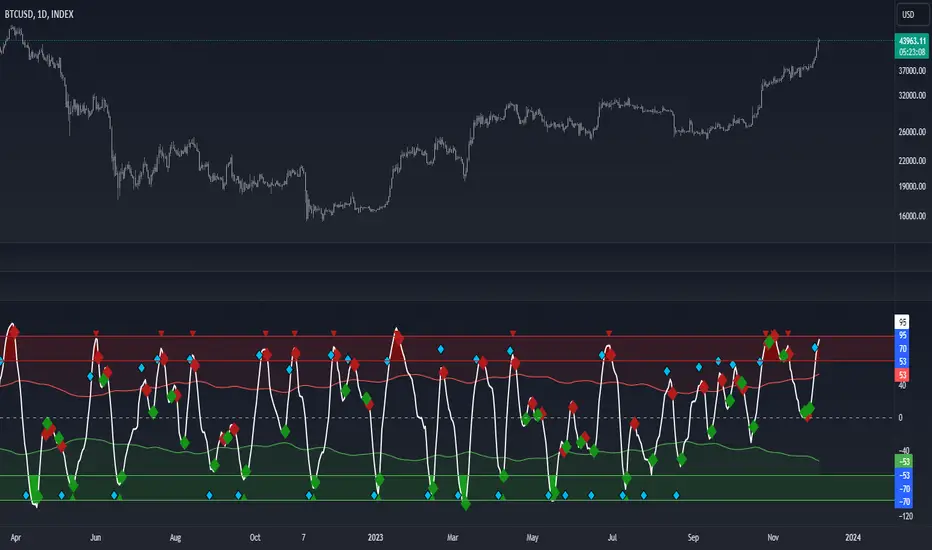
Basically we have few signals what VZO can show:
-Strong buy in oversold zone and strong sell in overbought zone. (Triangles at the top red and at the bottom green)
-Local Buy and Sell (Green and red Robustnesses)
-Posibility of trend change (Blue robustness)
Also you can webhook alerts to your spread sheet that sends values 1 for buys signals and -1 for sell signals in a range of 1 to 10 days
Here you can see marked signals on the chart

How volume zone oscillator work:
Like other VZO it uses the same principle of calculation Volume direction divided on total volume and then scaled to 100 and -100.
When we have positive momentum close > close[loockback] we have value of positive Volume, other way we have -volume negative one. <- this called a volume direction
Total volume is simply moving average with source of volume
And then MA with source of volume direction divided on MA of total colume and scaled it from 100 to -100
Basically we have few signals what VZO can show:
-Strong buy in oversold zone and strong sell in overbought zone. (Triangles at the top red and at the bottom green)
-Local Buy and Sell (Green and red Robustnesses)
-Posibility of trend change (Blue robustness)
Also you can webhook alerts to your spread sheet that sends values 1 for buys signals and -1 for sell signals in a range of 1 to 10 days
Here you can see marked signals on the chart
發行說明
Updated calculations and backtested. 發行說明
-發行說明
BackTest BTC Index (BackTest of local buys and local sells) BackTest ETH Index
https://www.tradingview.com/x/Dxb8cWuv/
發行說明
Organazide code, changed default inputs開源腳本
秉持TradingView一貫精神,這個腳本的創作者將其設為開源,以便交易者檢視並驗證其功能。向作者致敬!您可以免費使用此腳本,但請注意,重新發佈代碼需遵守我們的社群規範。
免責聲明
這些資訊和出版物並非旨在提供,也不構成TradingView提供或認可的任何形式的財務、投資、交易或其他類型的建議或推薦。請閱讀使用條款以了解更多資訊。
開源腳本
秉持TradingView一貫精神,這個腳本的創作者將其設為開源,以便交易者檢視並驗證其功能。向作者致敬!您可以免費使用此腳本,但請注意,重新發佈代碼需遵守我們的社群規範。
免責聲明
這些資訊和出版物並非旨在提供,也不構成TradingView提供或認可的任何形式的財務、投資、交易或其他類型的建議或推薦。請閱讀使用條款以了解更多資訊。