OPEN-SOURCE SCRIPT
已更新 NAS100 - 5 Minute Opening Range with EMAs
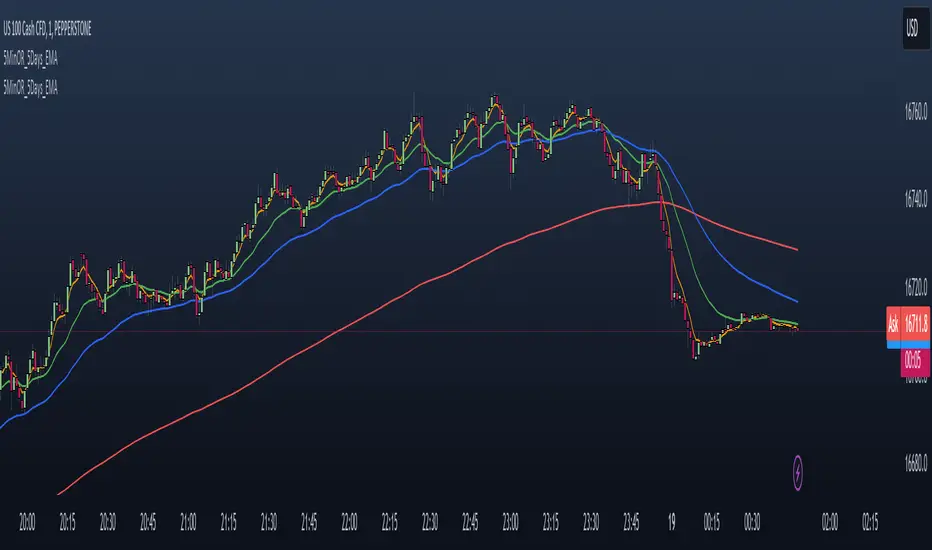
This indicator is designed for traders who focus on the opening range breakout strategy and use EMAs as part of their trading decisions. The script markes the first 5 min opening candle and generates Buy and Sell signals calculating EMA.
Basic features are :
User Inputs: Allows users to enable/disable alerts and choose to display Exponential Moving Averages (EMAs) for 5, 20, and 50 periods.
Opening Range Calculation: It calculates the first five minutes of the trading day, adjusting for different chart timeframes.
New Day Detection: Determines if the current bar is the first bar of a new day.
Data Storage: Utilizes arrays to store opening range highs, lows, start bars, and last bars for the last five days.
Daily Updates: Updates the stored data at the start of each new day, maintaining data for only the last five days.
Opening Range Plotting: Plots the opening ranges (high and low) for the past five days, with special plotting and filling for the current day.
EMA Calculation and Plotting: Calculates and plots EMAs (5, 20, and 50 periods) if enabled.
Alert Conditions: Sets up conditions for alerts when the price crosses above or below the current day's opening range.
Signal Generation: Generates buy and sell signals based on the relationship of the closing price to the opening range and the position of EMA5 relative to EMA50.
Signal Plotting: Plots buy and sell signals as triangles on the chart.
發行說明
Added 200 EMA開源腳本
秉持TradingView一貫精神,這個腳本的創作者將其設為開源,以便交易者檢視並驗證其功能。向作者致敬!您可以免費使用此腳本,但請注意,重新發佈代碼需遵守我們的社群規範。
免責聲明
這些資訊和出版物並非旨在提供,也不構成TradingView提供或認可的任何形式的財務、投資、交易或其他類型的建議或推薦。請閱讀使用條款以了解更多資訊。
開源腳本
秉持TradingView一貫精神,這個腳本的創作者將其設為開源,以便交易者檢視並驗證其功能。向作者致敬!您可以免費使用此腳本,但請注意,重新發佈代碼需遵守我們的社群規範。
免責聲明
這些資訊和出版物並非旨在提供,也不構成TradingView提供或認可的任何形式的財務、投資、交易或其他類型的建議或推薦。請閱讀使用條款以了解更多資訊。