OPEN-SOURCE SCRIPT
GLB — Green Line Breakout Indicator (v6)
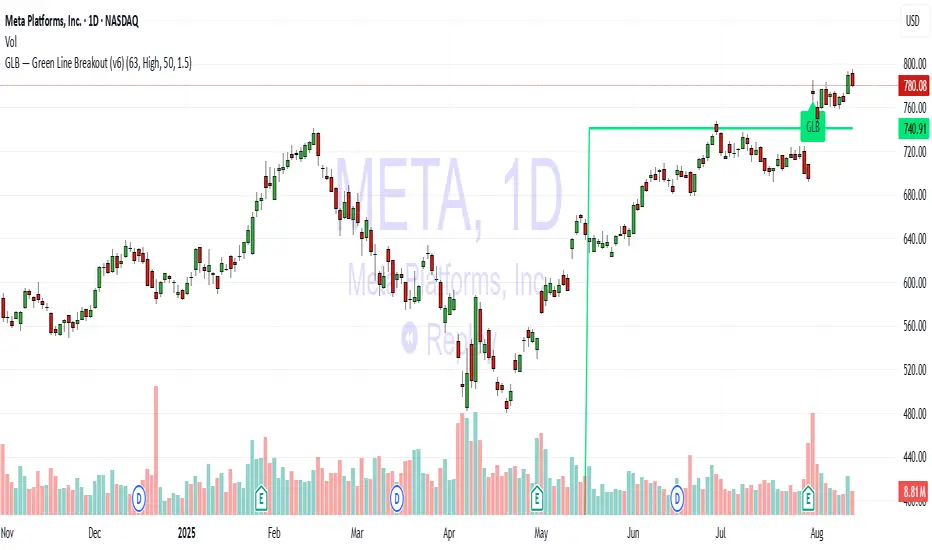
Understanding the GLB Strategy
According to Dr. Wish:
• GLB identifies stocks that hit a new all time high (ATH) and then consolidated (i.e., did not close above that high) for at least three months, forming what he calls the "green line."
• A breakout occurs when the stock closes above that green line level, often confirming strong buying interest and momentum (wishingwealthblog.com, wishingwealthblog.com).
開源腳本
秉持TradingView一貫精神,這個腳本的創作者將其設為開源,以便交易者檢視並驗證其功能。向作者致敬!您可以免費使用此腳本,但請注意,重新發佈代碼需遵守我們的社群規範。
免責聲明
這些資訊和出版物並非旨在提供,也不構成TradingView提供或認可的任何形式的財務、投資、交易或其他類型的建議或推薦。請閱讀使用條款以了解更多資訊。
開源腳本
秉持TradingView一貫精神,這個腳本的創作者將其設為開源,以便交易者檢視並驗證其功能。向作者致敬!您可以免費使用此腳本,但請注意,重新發佈代碼需遵守我們的社群規範。
免責聲明
這些資訊和出版物並非旨在提供,也不構成TradingView提供或認可的任何形式的財務、投資、交易或其他類型的建議或推薦。請閱讀使用條款以了解更多資訊。