INVITE-ONLY SCRIPT
已更新 Hendo's Momentum Fader Advanced

Momentum fader with volatillity index, directional bias, volatillity range and multiple settings.
How to use:
Pick a chart, mainly developed on XBT but supports every pair/index.
Pick a time frame:
1M, 5M, 15M, 30M, 1HR, 4HR. Other time frames are not yet supported.
Set your "volatillity setting"
Higher means bigger stop losses (and less risk/reward:more accuracy)
Last but not least:
Pick a setting for the algo to calculate with, every timeframe has multiple settings to work with.
Exits must be done manually, it's not a pivot to pivot indicator.
Interpretation:
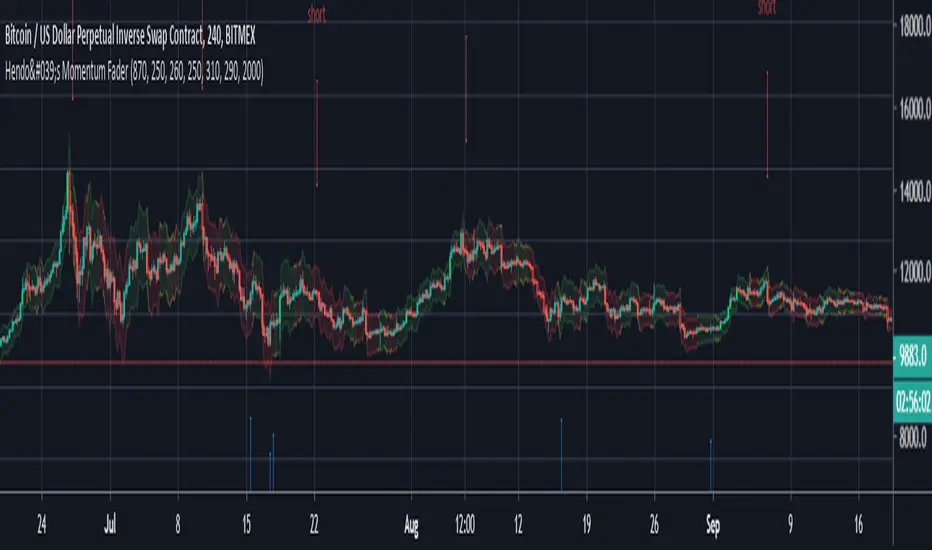
Lime green bars signal bullish pivots
Maroon red bars signal bearish pivots
The upper&lower boundaries of the "bands" are logical places to put stop losses outside of volatillity
The colouring of said bounderies indicate trend, likelihood of continuation.
Yellow: Pivot , Green: Bullish , Red: Bearish . Transitions from Yellow/Green to Red and the other way around are the most consistent.
Entries are also signalled in blue (long) or red (short) they are determined by the algo itself. 90% of them run in profit (some short term), keep in mind that exits must be done manually.
Access is ONLY for members.
Don't request the code, I'm not letting people "help" with developments nor am I selling the code.
Stay tuned for more!
發行說明
Improved some back end code and made optimalisations發行說明
Small error fixed發行說明
Made the colours of the main trading "bands" customizable. 發行說明
Fixed a small bug.發行說明
Added alerts on color changes發行說明
Update to improve the alert settings and conditions.發行說明
I've ran a few optimizations in the code. 發行說明
Removed a small error.僅限邀請腳本
只有經作者授權的使用者才能訪問此腳本,且通常需付費。您可以將此腳本加入收藏,但需先向作者申請並獲得許可後才能使用 — 點擊此處了解更多。如需更多詳情,請依照作者說明或直接聯繫ExLunaAdInfinitum。
除非您完全信任其作者並了解腳本的工作原理,否則TradingView不建議您付費或使用腳本。您也可以在我們的社群腳本中找到免費的開源替代方案。
作者的說明
提醒:在請求訪問權限之前,請閱讀僅限邀請腳本指南。
免責聲明
這些資訊和出版物並不意味著也不構成TradingView提供或認可的金融、投資、交易或其他類型的意見或建議。請在使用條款閱讀更多資訊。
僅限邀請腳本
只有經作者授權的使用者才能訪問此腳本,且通常需付費。您可以將此腳本加入收藏,但需先向作者申請並獲得許可後才能使用 — 點擊此處了解更多。如需更多詳情,請依照作者說明或直接聯繫ExLunaAdInfinitum。
除非您完全信任其作者並了解腳本的工作原理,否則TradingView不建議您付費或使用腳本。您也可以在我們的社群腳本中找到免費的開源替代方案。
作者的說明
提醒:在請求訪問權限之前,請閱讀僅限邀請腳本指南。
免責聲明
這些資訊和出版物並不意味著也不構成TradingView提供或認可的金融、投資、交易或其他類型的意見或建議。請在使用條款閱讀更多資訊。