OPEN-SOURCE SCRIPT
Interactive trendline
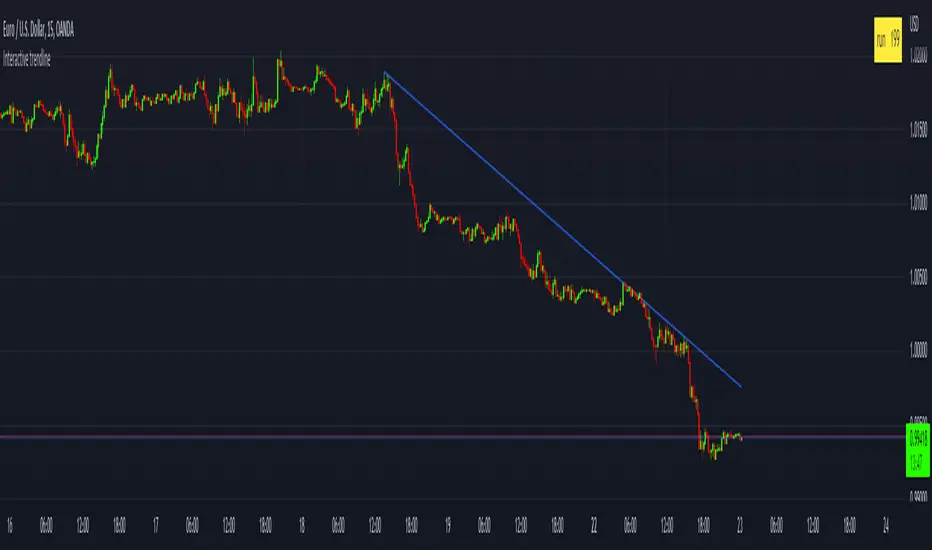
This is a concept that I have been playing with
to make a manual trend line that has more then just two connecting dots
but that has sequential data connected on every bar between the
beginning an the end point that can then be used to determine a break of trend or
a bounce.
This is added in a few simple steps
1) add the indicator to your chart
2) set the x_1 time bar
3) set the y_1 price
4) set the x_2 time bar
5) set the y_2 price
6) check the table that calculated the run value and enter that value in the settings box in the "Run" input box
開源腳本
秉持TradingView一貫精神,這個腳本的創作者將其設為開源,以便交易者檢視並驗證其功能。向作者致敬!您可以免費使用此腳本,但請注意,重新發佈代碼需遵守我們的社群規範。
免責聲明
這些資訊和出版物並非旨在提供,也不構成TradingView提供或認可的任何形式的財務、投資、交易或其他類型的建議或推薦。請閱讀使用條款以了解更多資訊。
開源腳本
秉持TradingView一貫精神,這個腳本的創作者將其設為開源,以便交易者檢視並驗證其功能。向作者致敬!您可以免費使用此腳本,但請注意,重新發佈代碼需遵守我們的社群規範。
免責聲明
這些資訊和出版物並非旨在提供,也不構成TradingView提供或認可的任何形式的財務、投資、交易或其他類型的建議或推薦。請閱讀使用條款以了解更多資訊。