INVITE-ONLY SCRIPT
Simulated Liquidations V1.0 [CE]
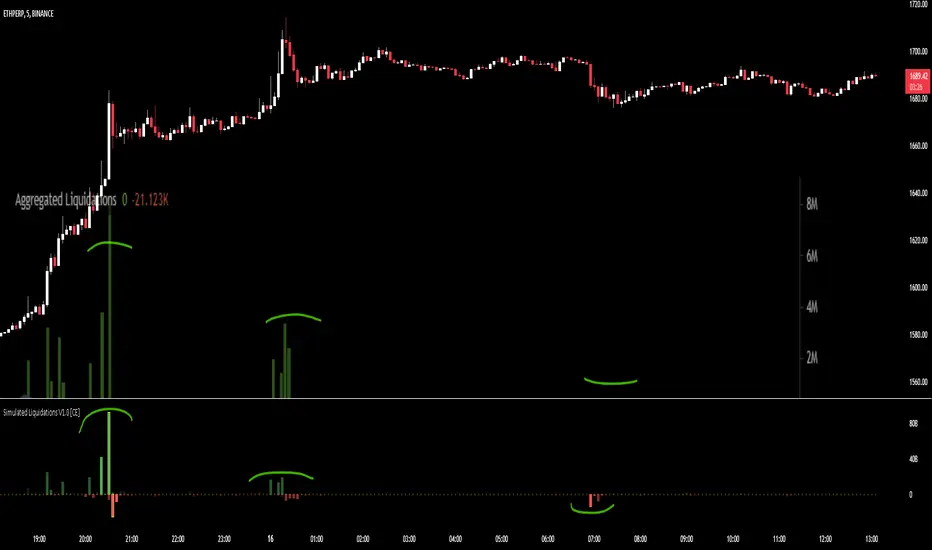
Simulated Liquidations [CE] is an custom calculation done on crypto symbols to bring liquidation data that is not available directly,
using a denomination of time/oi/volume/location the indicator aims to calculate accurately shaped zones for where liquidations are occurring.
Using the indicator can be useful to determine where moves may continue e.g. short side liquidations leading to short covering increasing the buying pressure.
In areas where traders may see buying demand + short covering this can lead to a "squeeze" and continued upward momentum.
Additionally we can use the liquidations in reversion strategies as well, as liquidations are sort after, when liquidity is then taken, we can see this as an opportunity to play reversion
with the necessary liquidity being "hunted" and no longer a magnet for price to revisit therefore price can then return to the mean.
The indicator also has 2 available modes, relative liquidations/normal.
The relative mode can be seen above which will make liquidations more visible when larger/significant, as well as highlight the liquidations when hitting extreme thresholds.
Below is an example with relative mode off.

To Do:
User customizable relative zones will be added soon, this will allow users to determine the thresholds for highlighting relative zones.
A screenshot of another chart is shown on the indicator, this is to highlight its accuracy in simulating liquidations.
using a denomination of time/oi/volume/location the indicator aims to calculate accurately shaped zones for where liquidations are occurring.
Using the indicator can be useful to determine where moves may continue e.g. short side liquidations leading to short covering increasing the buying pressure.
In areas where traders may see buying demand + short covering this can lead to a "squeeze" and continued upward momentum.
Additionally we can use the liquidations in reversion strategies as well, as liquidations are sort after, when liquidity is then taken, we can see this as an opportunity to play reversion
with the necessary liquidity being "hunted" and no longer a magnet for price to revisit therefore price can then return to the mean.
The indicator also has 2 available modes, relative liquidations/normal.
The relative mode can be seen above which will make liquidations more visible when larger/significant, as well as highlight the liquidations when hitting extreme thresholds.
Below is an example with relative mode off.
To Do:
- Add Custom Alerts
- Add User Customizable Relative zones
User customizable relative zones will be added soon, this will allow users to determine the thresholds for highlighting relative zones.
A screenshot of another chart is shown on the indicator, this is to highlight its accuracy in simulating liquidations.
僅限邀請腳本
僅作者批准的使用者才能訪問此腳本。您需要申請並獲得使用許可,通常需在付款後才能取得。更多詳情,請依照作者以下的指示操作,或直接聯絡spacemanbtc。
TradingView不建議在未完全信任作者並了解其運作方式的情況下購買或使用腳本。您也可以在我們的社群腳本中找到免費的開源替代方案。
作者的說明
For access join on our website!
Website: https://www.cubansedge.com/
Discord here: discord.gg/NqDfZgxeku
免責聲明
這些資訊和出版物並非旨在提供,也不構成TradingView提供或認可的任何形式的財務、投資、交易或其他類型的建議或推薦。請閱讀使用條款以了解更多資訊。