OPEN-SOURCE SCRIPT
MMRI Chart (Primary)
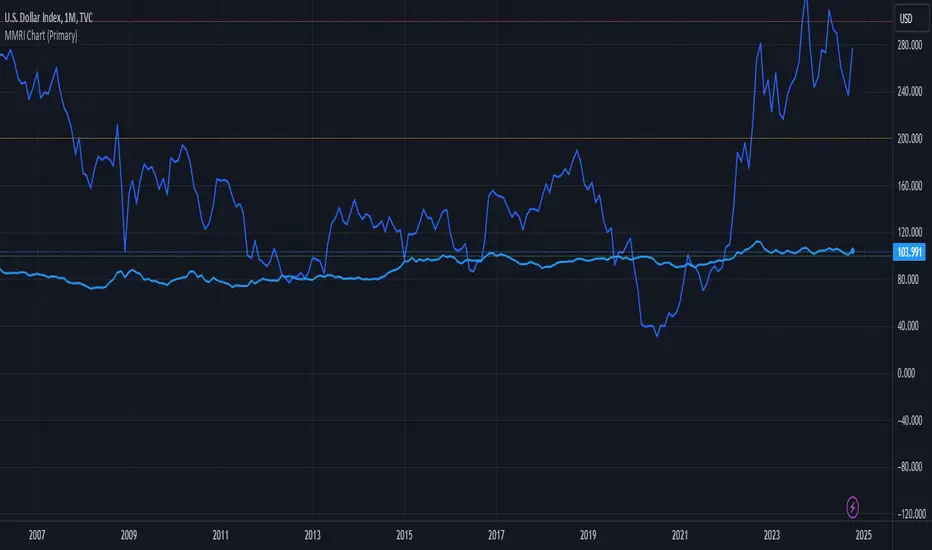
The **Mannarino Market Risk Indicator (MMRI)** is a financial risk measurement tool created by financial strategist Gregory Mannarino. It’s designed to assess the risk level in the stock market and economy based on current bond market conditions and the strength of the U.S. dollar. The MMRI considers factors like the U.S. 10-Year Treasury Yield and the Dollar Index (DXY), which indicate investor confidence in government debt and the dollar's purchasing power, respectively.
The formula for MMRI uses the 10-Year Treasury Yield multiplied by the Dollar Index, divided by a constant (1.61) to normalize the risk measure. A higher MMRI score suggests increased market risk, while a lower score indicates more stability. Mannarino has set certain thresholds to interpret the MMRI score:
- **Below 100**: Low risk.
- **100–200**: Moderate risk.
- **200–300**: High risk.
- **Above 300**: Extreme risk, indicating market instability and potential downturns.
This tool aims to provide insight into economic conditions that may affect asset classes like stocks, bonds, and precious metals. Mannarino often updates MMRI scores and risk analyses in his public market updates.
開源腳本
秉持TradingView一貫精神,這個腳本的創作者將其設為開源,以便交易者檢視並驗證其功能。向作者致敬!您可以免費使用此腳本,但請注意,重新發佈代碼需遵守我們的社群規範。
免責聲明
這些資訊和出版物並非旨在提供,也不構成TradingView提供或認可的任何形式的財務、投資、交易或其他類型的建議或推薦。請閱讀使用條款以了解更多資訊。
開源腳本
秉持TradingView一貫精神,這個腳本的創作者將其設為開源,以便交易者檢視並驗證其功能。向作者致敬!您可以免費使用此腳本,但請注意,重新發佈代碼需遵守我們的社群規範。
免責聲明
這些資訊和出版物並非旨在提供,也不構成TradingView提供或認可的任何形式的財務、投資、交易或其他類型的建議或推薦。請閱讀使用條款以了解更多資訊。