OPEN-SOURCE SCRIPT
已更新 MACD All In One Screener [ChartPrime]
INTRODUCTION
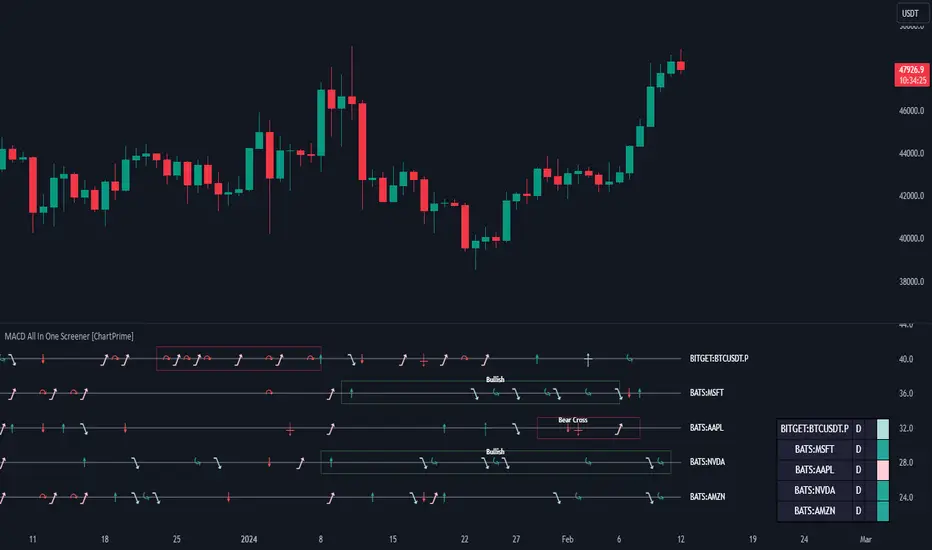
MACD All In One Screener (ChartPrime) is a multi instrument, multi timeframe indicator designed to provide traders with a comprehensive solution to monitoring the market. This indicator is designed to be easy to use and visually appealing while also being highly flexible and feature rich. Users can pick up to 10 symbols not including the chart's symbol and set up alerts for many different signals that the MACD produces. One standout feature of this indicator is its ability to display not only each symbol individually as a MACD but you can also view its chart from within this indicator. This removes the need to flip between symbols to see the price action for your basket.
On top of that we have designed this indicator to be friendly with "indicator on indicator" by providing outputs for all of the standards of price that users may want. Included is an overview section that shows all of the symbols signals symbolically over time. Additionally we have included a table for easy monitoring. This table includes the symbol, its timeframe, the current alert, and its histogram state. To make things as user friendly as possible we have also included rich error handling that tells you exactly what is wrong with your configuration.
HOW TO USE
To use this indicator, simply add it to your chart and navigate to the settings. From there select the symbols you want to monitor and the timeframes you want to use. Next you want to navigate down to the alerts section to select the what alerts you want to receive, and what symbols you want to get alerts for. Finally, you wan to create your alert using "Any alert() function call". Now your screener is all set up!
OVERVIEW OF INPUTS
View allows you to select what the indicator currently displays. You can pick from any one of the selected symbols, an overview of all of the symbols, or simply nothing. If you want to only use the table, "None" is provided so you can move the indicator into the chart panel.

View Toggle lets you pick from displaying the MACD for the selected symbol or the Price Action as a candle chart. To see your "indicator on indicator" you will have to select a symbol from the view list. There is a bug where if you select "Overview" while you are using "indicator on indicator" your added indicator will see the last symbol you viewed. To fix this, simply change the setting of your overlaid indicator and it will correct its self.

History Length is the number of historical bars to calculate over. This feature is here to prevent the indicator from breaking due to uneven historical data between the symbols.
Show Price Line toggles a dotted line that follows the current symbols closing price when "Price" is selected under the "View Toggle" dropdown.
Show Symbol Label toggles a label that displays the current symbols name and timeframe. This only impacts the single symbol view.
Overview Label Color adjusts the color of the symbol labels for both overview and single symbol view.
MA Type lets you pick what kind of moving average you want to use for the oscillator or signal. You can pick from the standard SMA or EMA.
Fast Length is a standard input for MACD. This lets you pick the period of the fast MA.
Slow Length, just like Fast Lenght, is a standard input for MACD. This lets you pick the period of the slow MA.
Signal Length is another standard input for MACD. This lets you configure the period of the signal MA.
MACD Cross Overlay Icon is a toggle to display MACD crosses when viewing a single symbol's MACD. When the MACD has a bullish cross it will plot a bullish dot, and when it has a bearish cross it will plot a bearish dot. This is purely visual.
Regular Bullish and Bearish toggles the visual display of the divergences on the single symbol view. This does not effect the indicators ability do send alerts.
Divergence Look Right adjusts the number of bars into the future to look for confirmation of a signal. This directly impacts lag but enhances stability.
Divergence Look Left adjusts the number of bars into the past to check for a signal. A longer period will filter out smaller moves
Maximum Lookback adjusts the maximum size of a divergence.
Minimum Lookback adjusts the minimum size of a divergence.
Divergence Drawings picks how you want to visualize the divergence. You can pick from displaying it as a line, a label, or both.

Enable Table toggles the overview table. When enabled it will show you the enabled symbols and their current state. From left to right: symbol name, timeframe, current alert, and histogram state.
Position picks where on the chart you want the table to be.
Text Color adjusts the text color of the table.
BG Color adjusts the background color of the table.
Frame Color adjust the frame color of the table.

Current Symbol Time Frame adjusts the timeframe of the chart's symbol.
Symbol 1 - 10 pick "Symbol's" symbol and timeframe. To use higher timeframes, the symbol's have to be the same type. You can't have a crypto and a stock using HTF at the same time as they don't have the same sessions and will result in an error. You can use unsafe mode (as described below) to potentially get around this.
Enable Symbol when enabled it will give you alerts for the symbol. This also enables the symbol in the overview. If this is disabled it won't send alerts, and it will not show up in overview, or the table.
Wait for Close enables waiting for the bar to close before printing an alert.
Alert Symbol Size picks what size you want the overview symbols to be.
Enable Cross Over 0 Alert: MACD crosses over the 0 line.
Enable Cross Under 0 Alert: MACD crosses under the 0 line.
Enable MACD Cross Bullish Alert: Bullish MACD cross.
Enable MACD Cross Bearish Alert: Bearish MACD cross.
Enable Histogram Bullish Turn Alert: MACD begins to turn bullish but hasn't crossed.
Enable Histogram Bearish Turn Alert: MACD begins to turn bearish but hasn't crossed.
Enable Histogram Bullish Continuation Alert: MACD is in a bullish cross state and it was declining but began rising again.
Enable Histogram Bearish Continuation Alert: MACD is in a bearish cross state and it was rising but began falling again.
Enable Bullish/Bearish Divergence Alert enables divergence alerts. Divergences are lagging, especially on a higher timeframe. These alerts will also tell you the time in the past when the divergence occurred.
Color Section is provided to allow for personalization of the indicator. Everything can be adjusted here.
Disable Error Checking: Only enable this if you want to bypass the built in error checking. This will enable 'Safe Requesting'. Safe Requesting will only request enabled symbols and you will not be able to view symbols that are not enabled in this mode. Only use this if you want to mix symbol types and you know it will work. (An example would be viewing stocks and SPY at the same time.)
CONCLUSION
The MACD All In One Screener (ChartPrime) is a versatile indicator designed to monitor multiple symbols across various timeframes. The flexibility in customization, from MACD settings to visual alerts and table presentations, allows users to tailor the screener to their needs and preferences. We hope you find this as useful and interesting as we do and wish you good luck in the market!
Enjoy
MACD All In One Screener (ChartPrime) is a multi instrument, multi timeframe indicator designed to provide traders with a comprehensive solution to monitoring the market. This indicator is designed to be easy to use and visually appealing while also being highly flexible and feature rich. Users can pick up to 10 symbols not including the chart's symbol and set up alerts for many different signals that the MACD produces. One standout feature of this indicator is its ability to display not only each symbol individually as a MACD but you can also view its chart from within this indicator. This removes the need to flip between symbols to see the price action for your basket.
On top of that we have designed this indicator to be friendly with "indicator on indicator" by providing outputs for all of the standards of price that users may want. Included is an overview section that shows all of the symbols signals symbolically over time. Additionally we have included a table for easy monitoring. This table includes the symbol, its timeframe, the current alert, and its histogram state. To make things as user friendly as possible we have also included rich error handling that tells you exactly what is wrong with your configuration.
HOW TO USE
To use this indicator, simply add it to your chart and navigate to the settings. From there select the symbols you want to monitor and the timeframes you want to use. Next you want to navigate down to the alerts section to select the what alerts you want to receive, and what symbols you want to get alerts for. Finally, you wan to create your alert using "Any alert() function call". Now your screener is all set up!
OVERVIEW OF INPUTS
View allows you to select what the indicator currently displays. You can pick from any one of the selected symbols, an overview of all of the symbols, or simply nothing. If you want to only use the table, "None" is provided so you can move the indicator into the chart panel.
View Toggle lets you pick from displaying the MACD for the selected symbol or the Price Action as a candle chart. To see your "indicator on indicator" you will have to select a symbol from the view list. There is a bug where if you select "Overview" while you are using "indicator on indicator" your added indicator will see the last symbol you viewed. To fix this, simply change the setting of your overlaid indicator and it will correct its self.
History Length is the number of historical bars to calculate over. This feature is here to prevent the indicator from breaking due to uneven historical data between the symbols.
Show Price Line toggles a dotted line that follows the current symbols closing price when "Price" is selected under the "View Toggle" dropdown.
Show Symbol Label toggles a label that displays the current symbols name and timeframe. This only impacts the single symbol view.
Overview Label Color adjusts the color of the symbol labels for both overview and single symbol view.
MA Type lets you pick what kind of moving average you want to use for the oscillator or signal. You can pick from the standard SMA or EMA.
Fast Length is a standard input for MACD. This lets you pick the period of the fast MA.
Slow Length, just like Fast Lenght, is a standard input for MACD. This lets you pick the period of the slow MA.
Signal Length is another standard input for MACD. This lets you configure the period of the signal MA.
MACD Cross Overlay Icon is a toggle to display MACD crosses when viewing a single symbol's MACD. When the MACD has a bullish cross it will plot a bullish dot, and when it has a bearish cross it will plot a bearish dot. This is purely visual.
Regular Bullish and Bearish toggles the visual display of the divergences on the single symbol view. This does not effect the indicators ability do send alerts.
Divergence Look Right adjusts the number of bars into the future to look for confirmation of a signal. This directly impacts lag but enhances stability.
Divergence Look Left adjusts the number of bars into the past to check for a signal. A longer period will filter out smaller moves
Maximum Lookback adjusts the maximum size of a divergence.
Minimum Lookback adjusts the minimum size of a divergence.
Divergence Drawings picks how you want to visualize the divergence. You can pick from displaying it as a line, a label, or both.
Enable Table toggles the overview table. When enabled it will show you the enabled symbols and their current state. From left to right: symbol name, timeframe, current alert, and histogram state.
Position picks where on the chart you want the table to be.
Text Color adjusts the text color of the table.
BG Color adjusts the background color of the table.
Frame Color adjust the frame color of the table.
Current Symbol Time Frame adjusts the timeframe of the chart's symbol.
Symbol 1 - 10 pick "Symbol's" symbol and timeframe. To use higher timeframes, the symbol's have to be the same type. You can't have a crypto and a stock using HTF at the same time as they don't have the same sessions and will result in an error. You can use unsafe mode (as described below) to potentially get around this.
Enable Symbol when enabled it will give you alerts for the symbol. This also enables the symbol in the overview. If this is disabled it won't send alerts, and it will not show up in overview, or the table.
Wait for Close enables waiting for the bar to close before printing an alert.
Alert Symbol Size picks what size you want the overview symbols to be.
Enable Cross Over 0 Alert: MACD crosses over the 0 line.
Enable Cross Under 0 Alert: MACD crosses under the 0 line.
Enable MACD Cross Bullish Alert: Bullish MACD cross.
Enable MACD Cross Bearish Alert: Bearish MACD cross.
Enable Histogram Bullish Turn Alert: MACD begins to turn bullish but hasn't crossed.
Enable Histogram Bearish Turn Alert: MACD begins to turn bearish but hasn't crossed.
Enable Histogram Bullish Continuation Alert: MACD is in a bullish cross state and it was declining but began rising again.
Enable Histogram Bearish Continuation Alert: MACD is in a bearish cross state and it was rising but began falling again.
Enable Bullish/Bearish Divergence Alert enables divergence alerts. Divergences are lagging, especially on a higher timeframe. These alerts will also tell you the time in the past when the divergence occurred.
Color Section is provided to allow for personalization of the indicator. Everything can be adjusted here.
Disable Error Checking: Only enable this if you want to bypass the built in error checking. This will enable 'Safe Requesting'. Safe Requesting will only request enabled symbols and you will not be able to view symbols that are not enabled in this mode. Only use this if you want to mix symbol types and you know it will work. (An example would be viewing stocks and SPY at the same time.)
CONCLUSION
The MACD All In One Screener (ChartPrime) is a versatile indicator designed to monitor multiple symbols across various timeframes. The flexibility in customization, from MACD settings to visual alerts and table presentations, allows users to tailor the screener to their needs and preferences. We hope you find this as useful and interesting as we do and wish you good luck in the market!
Enjoy
發行說明
Patched characters for Mac開源腳本
本著TradingView的真正精神,此腳本的創建者將其開源,以便交易者可以查看和驗證其功能。向作者致敬!雖然您可以免費使用它,但請記住,重新發佈程式碼必須遵守我們的網站規則。
免責聲明
這些資訊和出版物並不意味著也不構成TradingView提供或認可的金融、投資、交易或其他類型的意見或建議。請在使用條款閱讀更多資訊。
開源腳本
本著TradingView的真正精神,此腳本的創建者將其開源,以便交易者可以查看和驗證其功能。向作者致敬!雖然您可以免費使用它,但請記住,重新發佈程式碼必須遵守我們的網站規則。
免責聲明
這些資訊和出版物並不意味著也不構成TradingView提供或認可的金融、投資、交易或其他類型的意見或建議。請在使用條款閱讀更多資訊。