PROTECTED SOURCE SCRIPT
已更新 Expanded Reversal System (4 Pattern Types) Indicator + S/L
Overview
This is a comprehensive and fully customizable indicator designed to provide clear, reliable, and non-repainting signals for manual traders. Built on a robust 3-bar confirmation logic, this tool aims to eliminate the common errors and visual bugs found in simpler indicators, giving you a professional-grade tool for identifying high-probability reversals.
The indicator not only provides entry signals but also plots the precise Stop Loss level for each setup, taking the guesswork out of your risk management.
How to Trade with This Indicator 🎯
This indicator provides all the necessary information to plan and execute a trade. Here is the step-by-step process:
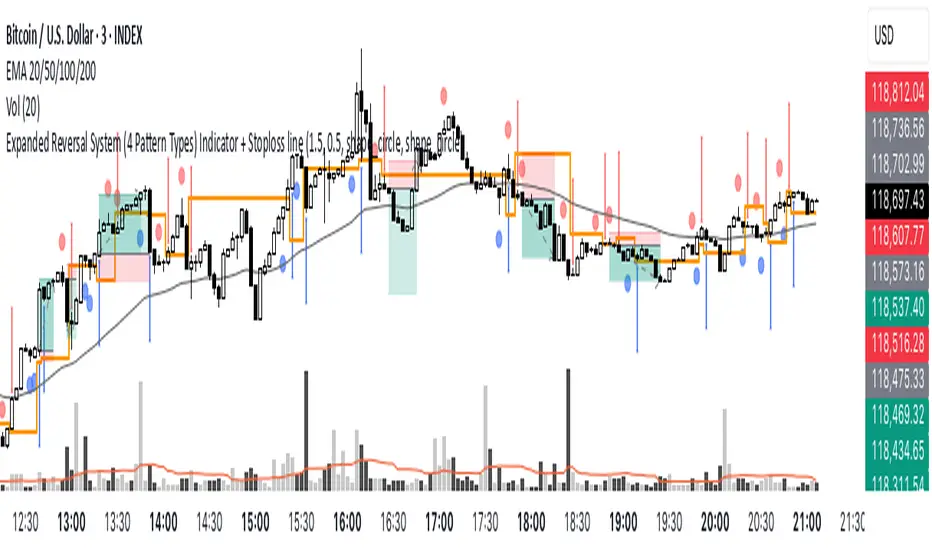
Step 1: The Setup Circle
First, wait for a Setup Signal (a blue or red circle) to appear on a candle. This is your "heads-up" that a potential trade is forming. This candle is the "Setup Candle."
Step 2: The Trigger Arrow
Next, wait for a Blue BUY Arrow (▲) or a Red SELL Arrow (▼) to appear. This is your confirmation and your signal to prepare to enter.
Step 3: The Entry
You enter the trade at the open of the candle the arrow appears on. This is the "Entry Candle."
Step 4: The Stop Loss
The indicator automatically plots a horizontal orange line on your chart at the same time as the Entry Arrow. This line represents your exact Stop Loss level. It is placed at the low (for buys) or high (for sells) of the candle marked with the Setup Circle.
Step 5: The Take Profit (Risk/Reward)
The Take Profit level must be calculated based on the strategy's Risk/Reward (R:R) ratio.
Step 6: Early invalidation would be a signal in the opposite direction confirmed by an arrow to enter the trade, in that case close the trade and enter in the opposite direction, that's how the strategy has been tested with amazing results.
But if you wish, you could use other confluence for better confirmation, such as volume or bollinger bands.
Exchange assets do not work , you will ned to use the all time index for both the signal indicator and the strategy tester.
Use the trade tool in TV for longs or shorts
Then, apply the appropriate ratio:
Long (Buy) Take Profit (1:6 R:R):
Short (Sell) Take Profit (1:4 R:R):
Fully Customizable Settings 🔧
This indicator gives you full control. In the settings (⚙️ icon), you can:
Individually turn each of the four pattern types (Hammers, Engulfing, Piercing, Dark Cloud) ON or OFF.
Adjust the specific rules for what qualifies as a Pin Bar (Hammer/Shooting Star).
Change the color and shape of all signals (setup shapes, entry arrows, and the stop loss line).
Disclaimer: This is a tool for manual trading and does not constitute financial advice. All trading involves risk, and past performance is not a guarantee of future results. Please use this indicator responsibly as part of a comprehensive trading plan.
This is a comprehensive and fully customizable indicator designed to provide clear, reliable, and non-repainting signals for manual traders. Built on a robust 3-bar confirmation logic, this tool aims to eliminate the common errors and visual bugs found in simpler indicators, giving you a professional-grade tool for identifying high-probability reversals.
The indicator not only provides entry signals but also plots the precise Stop Loss level for each setup, taking the guesswork out of your risk management.
How to Trade with This Indicator 🎯
This indicator provides all the necessary information to plan and execute a trade. Here is the step-by-step process:
Step 1: The Setup Circle
First, wait for a Setup Signal (a blue or red circle) to appear on a candle. This is your "heads-up" that a potential trade is forming. This candle is the "Setup Candle."
Step 2: The Trigger Arrow
Next, wait for a Blue BUY Arrow (▲) or a Red SELL Arrow (▼) to appear. This is your confirmation and your signal to prepare to enter.
Step 3: The Entry
You enter the trade at the open of the candle the arrow appears on. This is the "Entry Candle."
Step 4: The Stop Loss
The indicator automatically plots a horizontal orange line on your chart at the same time as the Entry Arrow. This line represents your exact Stop Loss level. It is placed at the low (for buys) or high (for sells) of the candle marked with the Setup Circle.
Step 5: The Take Profit (Risk/Reward)
The Take Profit level must be calculated based on the strategy's Risk/Reward (R:R) ratio.
Step 6: Early invalidation would be a signal in the opposite direction confirmed by an arrow to enter the trade, in that case close the trade and enter in the opposite direction, that's how the strategy has been tested with amazing results.
But if you wish, you could use other confluence for better confirmation, such as volume or bollinger bands.
Exchange assets do not work , you will ned to use the all time index for both the signal indicator and the strategy tester.
Use the trade tool in TV for longs or shorts
Then, apply the appropriate ratio:
Long (Buy) Take Profit (1:6 R:R):
Short (Sell) Take Profit (1:4 R:R):
Fully Customizable Settings 🔧
This indicator gives you full control. In the settings (⚙️ icon), you can:
Individually turn each of the four pattern types (Hammers, Engulfing, Piercing, Dark Cloud) ON or OFF.
Adjust the specific rules for what qualifies as a Pin Bar (Hammer/Shooting Star).
Change the color and shape of all signals (setup shapes, entry arrows, and the stop loss line).
Disclaimer: This is a tool for manual trading and does not constitute financial advice. All trading involves risk, and past performance is not a guarantee of future results. Please use this indicator responsibly as part of a comprehensive trading plan.
發行說明
Correction發行說明
Update fixed continuos line受保護腳本
此腳本以閉源形式發佈。 不過,您可以自由使用,沒有任何限制 — 點擊此處了解更多。
免責聲明
這些資訊和出版物並非旨在提供,也不構成TradingView提供或認可的任何形式的財務、投資、交易或其他類型的建議或推薦。請閱讀使用條款以了解更多資訊。
受保護腳本
此腳本以閉源形式發佈。 不過,您可以自由使用,沒有任何限制 — 點擊此處了解更多。
免責聲明
這些資訊和出版物並非旨在提供,也不構成TradingView提供或認可的任何形式的財務、投資、交易或其他類型的建議或推薦。請閱讀使用條款以了解更多資訊。