INVITE-ONLY SCRIPT
Dinapoli Objective Points (OPs)
The DiNapoli Objective Points (OPs) is a drawing tool that computes potential exit targets to a market. It does so by drawing Fibonacci ABC Extensions which form Areas that might condition future market moves. This is a Leading Indicator created by Joe DiNapoli.
Let’s dive into what this tool does.
HOW TO READ THE DINAPOLI OPs
First, let’s review the basic concepts. In the chart below you’ll see a market Up Swing and a Down Swing. Both charts show a significant Retracement within the scope of a larger Swing, and therefore are suitable for this tool.

On adding the tool to the chart, it will pop up a message asking the user to click for the 3 Points: A, B and C. Then, the tool will compute the Objective Points. Let’s review them:
By combining Objective Points with Dinapoli Levels, one can define Areas of Interest that might act as reinforced Support or Resistance levels. The Agreement Area happens where there’s a convergence between a Fibonacci Node and an Objective Point.
WHY WOULD YOU BE INTERESTED IN THIS INDICATOR?
This version of Dinapoli Levels has been designed to address the needs of dedicated traders. Let’s review its main features.
Combine Objective Points with D-Levels!

This tool allows you to quickly compute the Objective Points and display them in a minimalistic non-intrusive fashion.
The fact that the Objective Points get drawn on the right hand side of the chart combines perfectly with the Dinapoli Levels tools.
Keep your Chart Clean!

Disciplined traders keep their charts clean and visually appealing. One needs proper focus to trade in the zone.
Please check how the chart on the left looks compared to the one on the right. Both display exactly the same information. On the right it uses the DiNapoli Objective Points to print the Extensions, whilst on the right it uses the standard Fibonacci Extension tool.
The DiNapoli Objective Points use a view concentrated into the empty right side of the chart, which contributes to a more comprehensive display of information. There are no lines crossing over the price candles. It’s just a better tool. It keeps your charts free of messy lines.
EACH MARKET IN ITS OWN CHART
This tool somehow enhances the functionality of a Fibonacci Extension Drawing Tool. Being in nature a drawing tool, it has been developed as an indicator because that’s the only way it can be done at the present moment in this platform.
Therefore it’s recommended to structure Each Market in its Own Chart. Being coded as an indicator, this tool benefits by displaying over a chart dedicated to a single market.
If you trade on multiple markets, then it’s convenient to set up separate charts for each one. Otherwise, you would need to apply, delete and reapply the tool every time you shift markets.
SETTINGS
Now let’s dive into the settings of this indicator.
ABC Points: This section contains the ABC price points selected and its label visualization controls.
Levels: This section allows you to customize the look of the Dinapoli Objective Points.
Let’s dive into what this tool does.
HOW TO READ THE DINAPOLI OPs
First, let’s review the basic concepts. In the chart below you’ll see a market Up Swing and a Down Swing. Both charts show a significant Retracement within the scope of a larger Swing, and therefore are suitable for this tool.
- A Point: That’s the base Reaction Point. In up swings, it’s usually a significant pivot low, while in down swings it’s a pivot high.
- B Point: That’s the Focus Point that will define the extent of the extensions. In up swings, it’s usually a significant pivot high, while in down swings it’s a pivot low.
- C Point: That’s the Retracement Point from where the extensions will be drawn. The C Point is contained within the A-B Price Range, and often coincides with a Fibonacci Node.
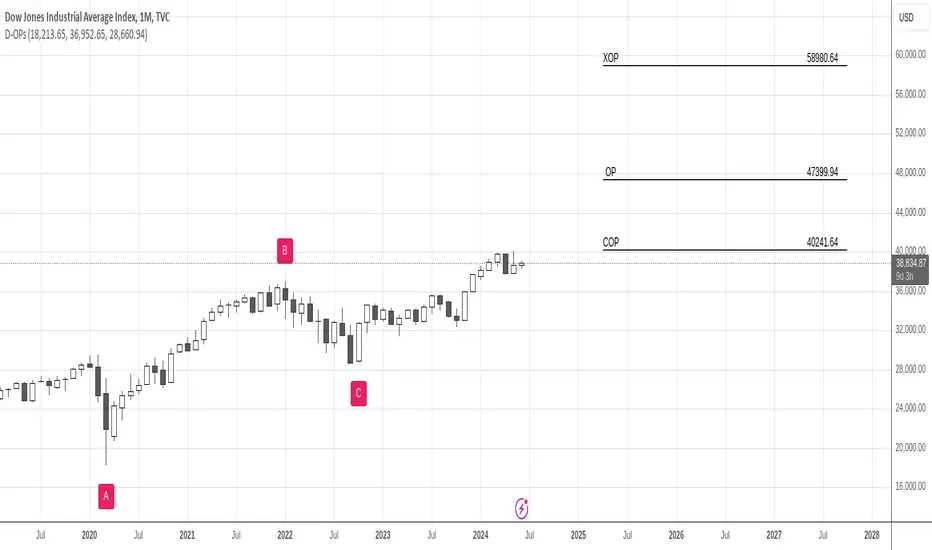
On adding the tool to the chart, it will pop up a message asking the user to click for the 3 Points: A, B and C. Then, the tool will compute the Objective Points. Let’s review them:
- COP: It’s the 61.8% Fibonacci Extension. It’s called COP as an acronym for Contracted Objective Point. It’s commonly used as an early Take Profit level or also as a point at which to enable a Trailing Stop Loss.
- OP: It’s the 100% Fibonacci Extension. It’s called OP as an acronym for the main Objective Point. It’s usually used as a level where to Take Profit.
- XOP: It’s the 161.8% Fibonacci Extension. It’s called XOP as an acronym for Extended Objective Point. It’s usually employed as a Take Profit target in which to close the position or significantly reduce the position weight.
By combining Objective Points with Dinapoli Levels, one can define Areas of Interest that might act as reinforced Support or Resistance levels. The Agreement Area happens where there’s a convergence between a Fibonacci Node and an Objective Point.
WHY WOULD YOU BE INTERESTED IN THIS INDICATOR?
This version of Dinapoli Levels has been designed to address the needs of dedicated traders. Let’s review its main features.
Combine Objective Points with D-Levels!
This tool allows you to quickly compute the Objective Points and display them in a minimalistic non-intrusive fashion.
The fact that the Objective Points get drawn on the right hand side of the chart combines perfectly with the Dinapoli Levels tools.
Keep your Chart Clean!
Disciplined traders keep their charts clean and visually appealing. One needs proper focus to trade in the zone.
Please check how the chart on the left looks compared to the one on the right. Both display exactly the same information. On the right it uses the DiNapoli Objective Points to print the Extensions, whilst on the right it uses the standard Fibonacci Extension tool.
The DiNapoli Objective Points use a view concentrated into the empty right side of the chart, which contributes to a more comprehensive display of information. There are no lines crossing over the price candles. It’s just a better tool. It keeps your charts free of messy lines.
EACH MARKET IN ITS OWN CHART
This tool somehow enhances the functionality of a Fibonacci Extension Drawing Tool. Being in nature a drawing tool, it has been developed as an indicator because that’s the only way it can be done at the present moment in this platform.
Therefore it’s recommended to structure Each Market in its Own Chart. Being coded as an indicator, this tool benefits by displaying over a chart dedicated to a single market.
If you trade on multiple markets, then it’s convenient to set up separate charts for each one. Otherwise, you would need to apply, delete and reapply the tool every time you shift markets.
SETTINGS
Now let’s dive into the settings of this indicator.
ABC Points: This section contains the ABC price points selected and its label visualization controls.
- A-Point, B-Point and C-Point: These fields contain the prices that were selected when clicking on the chart. One can change their value by hand, and the indicator will do its best to accommodate the drawing.
- Highlight ABC Points: This conditions whether the A-B-C labels should display on screen.
- Back Color: Select the color that will be used to highlight the A-B-C labels.
- Text Color: Select the color that will be used to print the characters in the A-B-C labels.
Levels: This section allows you to customize the look of the Dinapoli Objective Points.
- Enable/Disable Level: Each Level (COP, OP and XOP) can be enabled or disabled.
- Level Color: Select the line color for that specific level. Please beware that the default color is 100% transparent. You might need to change the transparency setting in the color picker for the color you’ve selected to appear.
- Id: Shows the label identifying the Objective Point.
- Price: Shows the price value of the Objective Point.
- Offset: Determines how far to the right will the group of DiNapoli Objective Points be located.
- Width: Sets the width of the horizontal lines that represent the Objective Points.
- Thickness: Sets the line thickness of the lines.
僅限邀請腳本
僅作者批准的使用者才能訪問此腳本。您需要申請並獲得使用許可,通常需在付款後才能取得。更多詳情,請依照作者以下的指示操作,或直接聯絡gliderfund。
TradingView不建議在未完全信任作者並了解其運作方式的情況下購買或使用腳本。您也可以在我們的社群腳本中找到免費的開源替代方案。
作者的說明
To subscribe, please send me a Private Message through TradingView.
I develop indicators meant to be useful, profitable and good looking.
免責聲明
這些資訊和出版物並非旨在提供,也不構成TradingView提供或認可的任何形式的財務、投資、交易或其他類型的建議或推薦。請閱讀使用條款以了解更多資訊。