OPEN-SOURCE SCRIPT
Custom Support & Resistance Levels
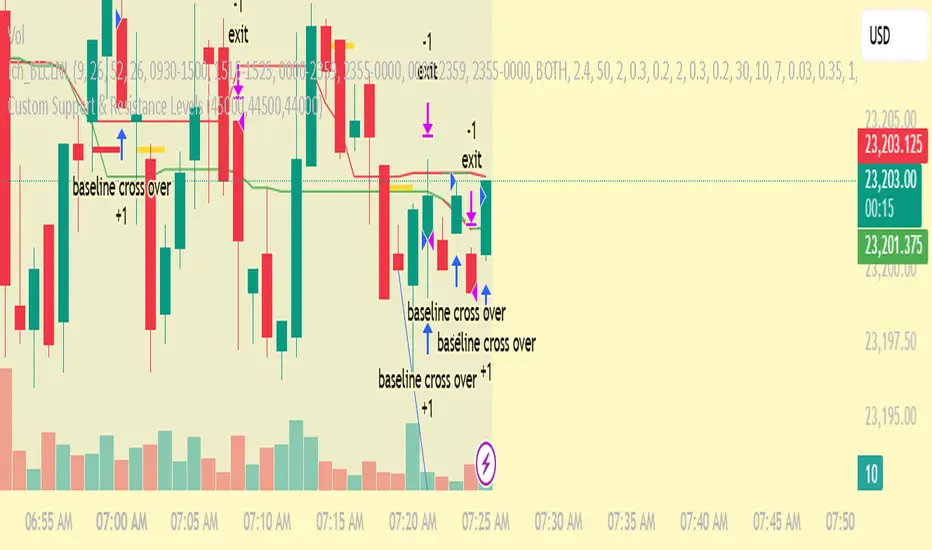
The Smart Auto Trendline Indicator is designed to help traders quickly identify key market trends without the need for manual drawing. It automatically detects swing highs and lows, plots dynamic trendlines, and updates them in real-time as price evolves.
This tool is especially useful for traders who rely on trendline breakouts, pullback entries, or reversal confirmations. By simplifying chart analysis, it saves time and ensures more consistent results.
Key Features:
🔹 Automatic detection of valid swing highs and lows
🔹 Dynamic trendline plotting (auto-adjusts as price moves)
🔹 Highlights potential breakout and breakdown zones
🔹 Works on all timeframes and instruments (Forex, Stocks, Indices, Crypto)
🔹 Clean, non-intrusive design to keep charts clear
🔹 Customizable settings (line color, style, sensitivity)
How to Use:
Apply the indicator to your chart.
Observe automatically drawn trendlines.
Watch for breakouts above/below trendlines for trade entries.
Use in combination with other tools like RSI, MACD, or support/resistance for stronger confirmation.
Best For:
Breakout traders
Swing traders
Trend followers
Forex, Stocks, Crypto, Indices
開源腳本
秉持TradingView一貫精神,這個腳本的創作者將其設為開源,以便交易者檢視並驗證其功能。向作者致敬!您可以免費使用此腳本,但請注意,重新發佈代碼需遵守我們的社群規範。
免責聲明
這些資訊和出版物並非旨在提供,也不構成TradingView提供或認可的任何形式的財務、投資、交易或其他類型的建議或推薦。請閱讀使用條款以了解更多資訊。
開源腳本
秉持TradingView一貫精神,這個腳本的創作者將其設為開源,以便交易者檢視並驗證其功能。向作者致敬!您可以免費使用此腳本,但請注意,重新發佈代碼需遵守我們的社群規範。
免責聲明
這些資訊和出版物並非旨在提供,也不構成TradingView提供或認可的任何形式的財務、投資、交易或其他類型的建議或推薦。請閱讀使用條款以了解更多資訊。