OPEN-SOURCE SCRIPT
3-10 MA Oscillator (Wyckoff) by malagadev
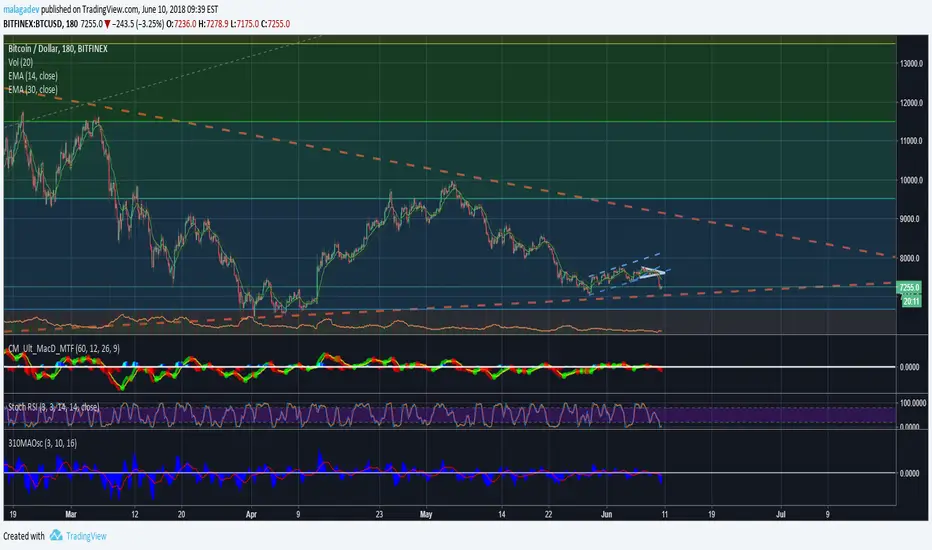
- If ControlSMA(16) [red line] exceeds 0 means market is bullish, below 0 means market is bearish.
- Difference between SMA(3,10) is represented with blue area.
- You can operate using changes in color or trend, or simply knowing that once 0 is crossed upwards, it means the pullback is proportional so we just need a simple pattern in the price or, entering after it just crosses.
- It's better to open positions in the first pullback after the ControlSMA(16) firstly crosses 0 ("First Cross").
- It's possible to operate using momentum divergences.
開源腳本
秉持TradingView一貫精神,這個腳本的創作者將其設為開源,以便交易者檢視並驗證其功能。向作者致敬!您可以免費使用此腳本,但請注意,重新發佈代碼需遵守我們的社群規範。
免責聲明
這些資訊和出版物並非旨在提供,也不構成TradingView提供或認可的任何形式的財務、投資、交易或其他類型的建議或推薦。請閱讀使用條款以了解更多資訊。
免責聲明
這些資訊和出版物並非旨在提供,也不構成TradingView提供或認可的任何形式的財務、投資、交易或其他類型的建議或推薦。請閱讀使用條款以了解更多資訊。