OPEN-SOURCE SCRIPT
X21
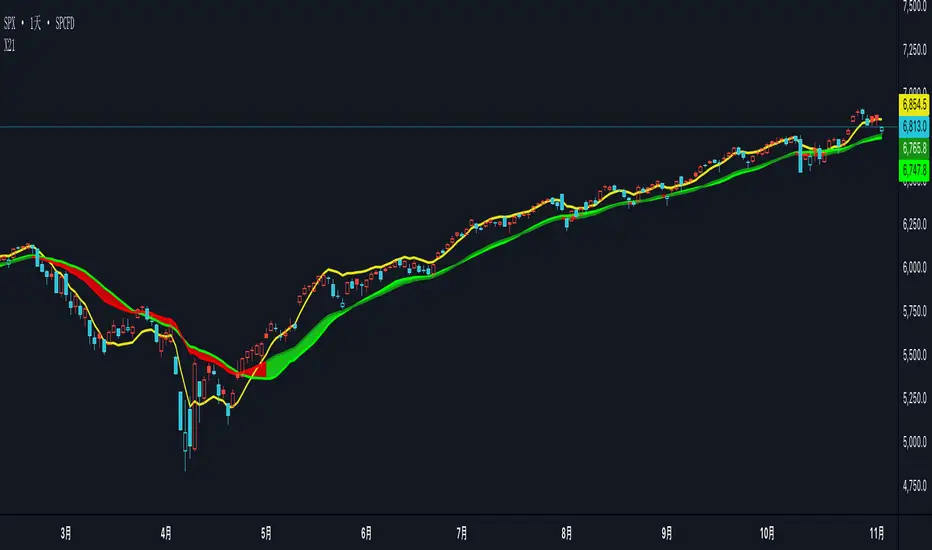
The X21 Dynamic Trend Indicator is an adaptive moving average system that combines SMA, EMA, and TEMA to provide real-time trend identification with dynamic color coding. This indicator automatically adjusts its visual presentation based on market conditions, making trend recognition intuitive and immediate.
Key Components
1. TEMA21 (Triple Exponential Moving Average)
Yellow Line - The most responsive trend indicator in the system
Significantly reduces lag compared to traditional moving averages
Formula: TEMA = 3×EMA1 - 3×EMA2 + EMA3
Provides early signals for potential trend changes
Ideal for timing entries and exits with minimal delay
2. SMA21 (Simple Moving Average)
Green Line - Always displayed in green regardless of trend direction
21-period simple moving average of closing prices
Represents the baseline trend reference
Acts as the primary support/resistance level in the system
3. EMA21 (Exponential Moving Average)
Dynamic Color Line - Changes color based on trend strength
Dark Green (#159015): Confirmed uptrend (bullish conditions)
Red (#f50000): Downtrend or weak trend (bearish/neutral conditions)
More responsive than SMA21 due to exponential weighting
Provides faster reaction to recent price movements
4. Dynamic Fill Band (SMA21/EMA21 Envelope)
Color-Coded Zone between SMA21 and EMA21
Light Green (#15e915, 19% transparency): Uptrend zone
Light Red (#f50000, 19% transparency): Downtrend zone
Visualizes the strength and volatility of the current trend
Width of the band indicates trend momentum and volatility
Trend Detection LogicThe indicator uses a dual-confirmation system for trend identification:
Price Position: Close must be above SMA21
Trend Slope: SMA21 must be rising (SMA21 > SMA21[1])
Both conditions must be met simultaneously for an uptrend confirmation.This conservative approach reduces false signals and ensures only h
開源腳本
秉持TradingView一貫精神,這個腳本的創作者將其設為開源,以便交易者檢視並驗證其功能。向作者致敬!您可以免費使用此腳本,但請注意,重新發佈代碼需遵守我們的社群規範。
免責聲明
這些資訊和出版物並非旨在提供,也不構成TradingView提供或認可的任何形式的財務、投資、交易或其他類型的建議或推薦。請閱讀使用條款以了解更多資訊。
免責聲明
這些資訊和出版物並非旨在提供,也不構成TradingView提供或認可的任何形式的財務、投資、交易或其他類型的建議或推薦。請閱讀使用條款以了解更多資訊。