OPEN-SOURCE SCRIPT
HTF Candle Support & Resistance «NoaTrader»
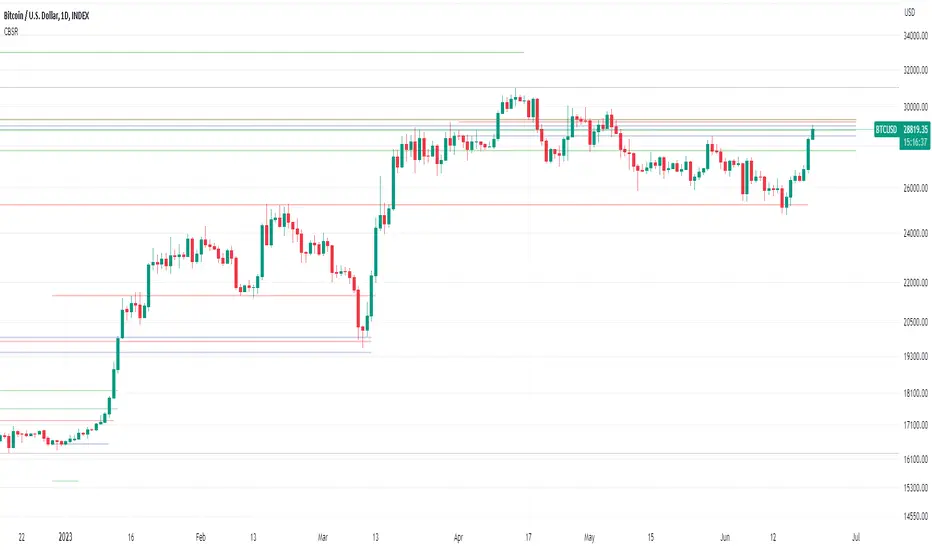
This script uses higher timeframe candle's High, Low & Close as a source for drawing a line representing potential Supports and Resistances.
The more lines you see on a level, probably the more important that level is.
The script has a single input for setting the source candle's timeframe, so it can be used on any timeframe with the proper settings. For example, higher timeframes like weekly and monthly can use "3M" or "12M" settings, Daily timeframes with "W", or even lower timeframes like minutes and seconds with "240" and "60" (M means monthly candle, W is weekly, and numbers are for minutes.)
As you can see on the code:
Give it a try on different timeframes with different settings to see interesting gaps between lines!
The more lines you see on a level, probably the more important that level is.
The script has a single input for setting the source candle's timeframe, so it can be used on any timeframe with the proper settings. For example, higher timeframes like weekly and monthly can use "3M" or "12M" settings, Daily timeframes with "W", or even lower timeframes like minutes and seconds with "240" and "60" (M means monthly candle, W is weekly, and numbers are for minutes.)
As you can see on the code:
- Red lines represent candle's High.
- Green lines represent candle's Low.
- Blue lines represent candle's Close.
Give it a try on different timeframes with different settings to see interesting gaps between lines!
開源腳本
秉持TradingView一貫精神,這個腳本的創作者將其設為開源,以便交易者檢視並驗證其功能。向作者致敬!您可以免費使用此腳本,但請注意,重新發佈代碼需遵守我們的社群規範。
免責聲明
這些資訊和出版物並非旨在提供,也不構成TradingView提供或認可的任何形式的財務、投資、交易或其他類型的建議或推薦。請閱讀使用條款以了解更多資訊。
免責聲明
這些資訊和出版物並非旨在提供,也不構成TradingView提供或認可的任何形式的財務、投資、交易或其他類型的建議或推薦。請閱讀使用條款以了解更多資訊。