INVITE-ONLY SCRIPT
已更新 Bonsai
Bonsai is a tailored tech analysis tool for all traders. It uses dynamic thresholds, sensitivity modes, and averaging to identify market trends. Its scoring system, visual cues, and alerts offer an intuitive trading journey.
═════════════════════════════════════════════════════════════════════════
🌳 Bonsai 🌳 Trend Analysis Indicator
📘 Overview
Bonsai is designed to aid traders in recognizing market trends, utilizing sensitivity as its pivotal component.
📌 Script Logic
• Threshold-Based Trends: Bonsai sets dynamic thresholds based on market deviations from previous highs or lows to identify trend reversals.
• Signal Generation: After ascertaining the trend direction, Bonsai provides buy/sell signals from trend crossovers and crossunders.
• Returns & Scoring: Each signal's potential returns are calculated, considering asset-specific trading fees. A scoring system (1-10) is introduced for traders to evaluate potential profitability quickly.
• Auto-Threshold: Threshold adjustments are made depending on the selected sensitivity mode, optimizing adaptability.
• Visual Indicators: Bonsai visualizes potential market highs and lows through trend lines. Colors differentiate between bullish and bearish market sentiments.
• Trend Line Enhancement with ALMA: Bonsai integrates the Arnaud Legoux Moving Average (ALMA), aiming to refine trend line representation. ALMA may reduce noise, providing a smoother trend line, which might be useful during volatile market conditions. This can potentially lead to improved trend forecasts with fewer fakeouts.
🎯 Purpose
• For Experienced Traders: Bonsai complements professional analysis with its data-driven insights, catering to diverse trading strategies.
• For Newcomers: Serving as an entry to technical analysis, Bonsai's intuitive design and streamlined settings are beginner-friendly.
🛠 Key Elements
• Dynamic Thresholds: Bonsai’s thresholds are dynamic, adapting to market conditions and user-selected sensitivity mode.
• Scoring System: Bonsai’s unique scoring system is grounded on potential returns, streamlining complex market data interpretation.
Performance Table Breakdown

🔧 Classic Elements & Value Added
• Refined Moving Averages: Bonsai incorporates standard moving averages like the EMA, SMA and ALMA to smooth and refine trend lines.
• Enhanced Visual Representation: Bonsai strives to provide clarity beyond just displaying market directions. Its visuals are crafted to help traders understand and potentially act promptly. The deliberate use of color dynamics, trend indications, and integration of moving averages come together to create a representation that aims to stand out in its clarity and simplicity.
📊 Features
• Dynamic Sensitivity Modes: Settings include:
• (Auto) Slow, Mid, Fast: These modes allow Bonsai to auto-adjust its sensitivity in line with market changes.
• 'Slow': Aims to capture larger market moves with fewer signals.
• 'Mid': A balanced mode with a moderate signal frequency.
• 'Fast': Caters to rapid market changes, providing more signals.
• Manual: For traders who prefer setting their sensitivity.
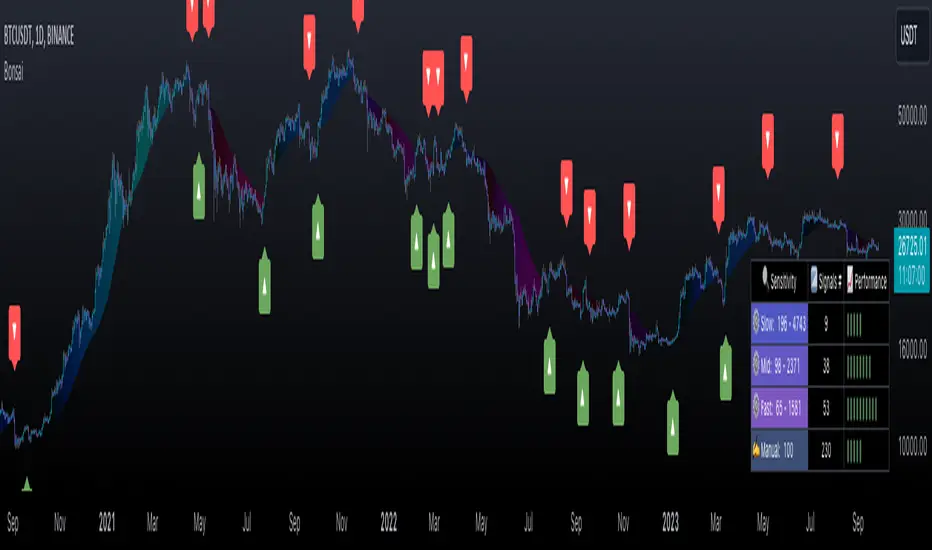
• Visualization: Green indicates bullish trends, and Red indicates bearish ones. Trend colors are customizable in gradient intensity and opacity.
• Performance Insights: A table displaying the effectiveness of all modes, guiding your strategy choices.
• Dashboard Themes: Users can switch between light and dark themes.
• Alert System: Real-time buy/sell signal notifications.
• Compatibility: Output can be integrated as a source for other indicators.
Indicator Settings Menu

🎛 How To Use Bonsai
1. Select your sensitivity mode.
2. Use color cues to analyze market directions.
3. Check the performance insights for strategy adjustment.
4. Set alerts to stay updated.
📜 Feedback & Improvement
We value your feedback. As the trading world evolves, Bonsai will adapt, meeting traders' dynamic needs.
❗️ Disclaimer
Bonsai serves as an analytical tool and isn’t a standalone trading strategy. Its performance table is for reference, and accuracy isn’t guaranteed. Always research thoroughly and be mindful of trading risks. Bonsai facilitates analysis but doesn’t promise particular outcomes.
═════════════════════════════════════════════════════════════════════════
🌳 Bonsai 🌳 Trend Analysis Indicator
📘 Overview
Bonsai is designed to aid traders in recognizing market trends, utilizing sensitivity as its pivotal component.
📌 Script Logic
• Threshold-Based Trends: Bonsai sets dynamic thresholds based on market deviations from previous highs or lows to identify trend reversals.
• Signal Generation: After ascertaining the trend direction, Bonsai provides buy/sell signals from trend crossovers and crossunders.
• Returns & Scoring: Each signal's potential returns are calculated, considering asset-specific trading fees. A scoring system (1-10) is introduced for traders to evaluate potential profitability quickly.
• Auto-Threshold: Threshold adjustments are made depending on the selected sensitivity mode, optimizing adaptability.
• Visual Indicators: Bonsai visualizes potential market highs and lows through trend lines. Colors differentiate between bullish and bearish market sentiments.
• Trend Line Enhancement with ALMA: Bonsai integrates the Arnaud Legoux Moving Average (ALMA), aiming to refine trend line representation. ALMA may reduce noise, providing a smoother trend line, which might be useful during volatile market conditions. This can potentially lead to improved trend forecasts with fewer fakeouts.
🎯 Purpose
• For Experienced Traders: Bonsai complements professional analysis with its data-driven insights, catering to diverse trading strategies.
• For Newcomers: Serving as an entry to technical analysis, Bonsai's intuitive design and streamlined settings are beginner-friendly.
🛠 Key Elements
• Dynamic Thresholds: Bonsai’s thresholds are dynamic, adapting to market conditions and user-selected sensitivity mode.
• Scoring System: Bonsai’s unique scoring system is grounded on potential returns, streamlining complex market data interpretation.
Performance Table Breakdown
🔧 Classic Elements & Value Added
• Refined Moving Averages: Bonsai incorporates standard moving averages like the EMA, SMA and ALMA to smooth and refine trend lines.
• Enhanced Visual Representation: Bonsai strives to provide clarity beyond just displaying market directions. Its visuals are crafted to help traders understand and potentially act promptly. The deliberate use of color dynamics, trend indications, and integration of moving averages come together to create a representation that aims to stand out in its clarity and simplicity.
📊 Features
• Dynamic Sensitivity Modes: Settings include:
• (Auto) Slow, Mid, Fast: These modes allow Bonsai to auto-adjust its sensitivity in line with market changes.
• 'Slow': Aims to capture larger market moves with fewer signals.
• 'Mid': A balanced mode with a moderate signal frequency.
• 'Fast': Caters to rapid market changes, providing more signals.
• Manual: For traders who prefer setting their sensitivity.
• Visualization: Green indicates bullish trends, and Red indicates bearish ones. Trend colors are customizable in gradient intensity and opacity.
• Performance Insights: A table displaying the effectiveness of all modes, guiding your strategy choices.
• Dashboard Themes: Users can switch between light and dark themes.
• Alert System: Real-time buy/sell signal notifications.
• Compatibility: Output can be integrated as a source for other indicators.
Indicator Settings Menu
🎛 How To Use Bonsai
1. Select your sensitivity mode.
2. Use color cues to analyze market directions.
3. Check the performance insights for strategy adjustment.
4. Set alerts to stay updated.
📜 Feedback & Improvement
We value your feedback. As the trading world evolves, Bonsai will adapt, meeting traders' dynamic needs.
❗️ Disclaimer
Bonsai serves as an analytical tool and isn’t a standalone trading strategy. Its performance table is for reference, and accuracy isn’t guaranteed. Always research thoroughly and be mindful of trading risks. Bonsai facilitates analysis but doesn’t promise particular outcomes.
發行說明
- Updated output plot labels to "🌳 Buy ▲" for buy signals and "🌳 Sell ▼" for sell signals.
僅限邀請腳本
僅作者批准的使用者才能訪問此腳本。您需要申請並獲得使用許可,通常需在付款後才能取得。更多詳情,請依照作者以下的指示操作,或直接聯絡bonsai_trade。
TradingView不建議在未完全信任作者並了解其運作方式的情況下購買或使用腳本。您也可以在我們的社群腳本中找到免費的開源替代方案。
作者的說明
Explore this tool and a range of others at https://bonsai.trade - For assistance, reach out to us at support@bonsai.trade.
免責聲明
這些資訊和出版物並非旨在提供,也不構成TradingView提供或認可的任何形式的財務、投資、交易或其他類型的建議或推薦。請閱讀使用條款以了解更多資訊。