OPEN-SOURCE SCRIPT
StDev Bands
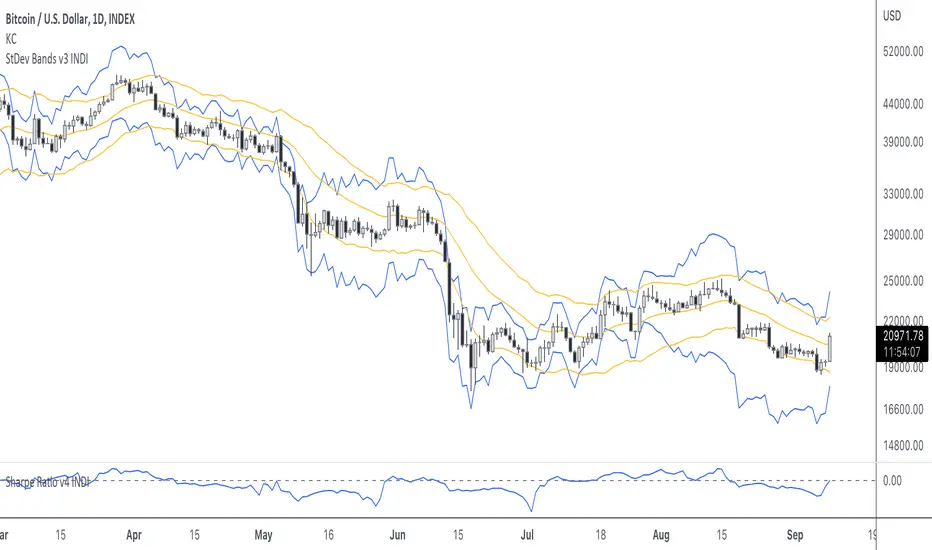
This is a "bands"-type indicator. It was developed out of my Sharpe Ratio indicator. It uses the standard deviation of returns as basis for drawing the bands. I'm going to update this indicator as the other indicator evolves. Please be sure you know how to calculate Sharpe Ratio and check out the Sharpe Ratio indicator as well. This will help you understand the purpose of this indicator a bit more.
As a very short introduction. Many investors use the standard deviation of returns as risk measurement. I admit the defaults of this indicator aren't perfect. Normally investors use the standard deviation over a 1 year period. Traditional finance uses 265 days, and because crypto never sleeps, we could use 365. I defaulted it to 20.
As a very short introduction. Many investors use the standard deviation of returns as risk measurement. I admit the defaults of this indicator aren't perfect. Normally investors use the standard deviation over a 1 year period. Traditional finance uses 265 days, and because crypto never sleeps, we could use 365. I defaulted it to 20.
開源腳本
秉持TradingView一貫精神,這個腳本的創作者將其設為開源,以便交易者檢視並驗證其功能。向作者致敬!您可以免費使用此腳本,但請注意,重新發佈代碼需遵守我們的社群規範。
免責聲明
這些資訊和出版物並非旨在提供,也不構成TradingView提供或認可的任何形式的財務、投資、交易或其他類型的建議或推薦。請閱讀使用條款以了解更多資訊。
免責聲明
這些資訊和出版物並非旨在提供,也不構成TradingView提供或認可的任何形式的財務、投資、交易或其他類型的建議或推薦。請閱讀使用條款以了解更多資訊。