OPEN-SOURCE SCRIPT
已更新 Bullish/Bearish Candelstick pattern
Hey!
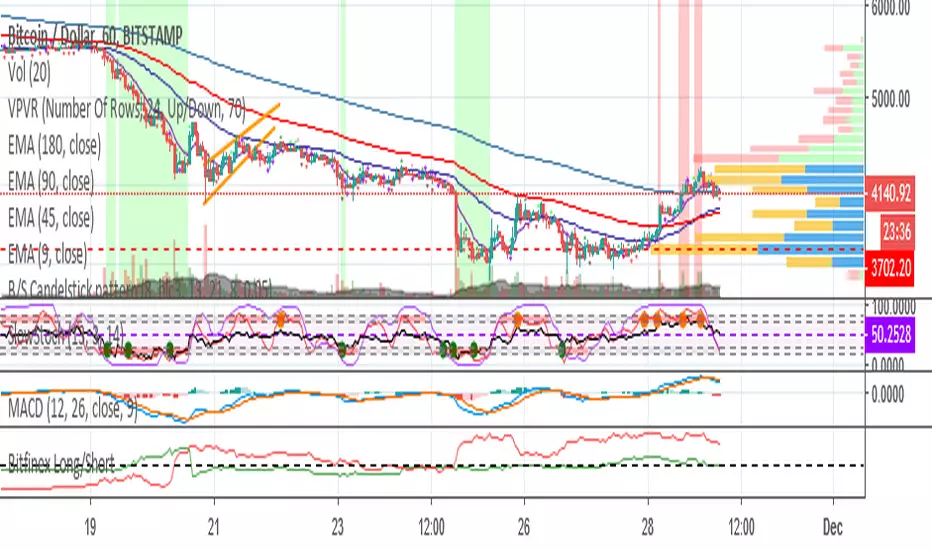
This time I took the pattern recognizer from a previous script I worked.
It overlays the Arrows on the chart.
Legend:
#Maroon colour: Strong bearish signal
#Red colour: Bearish signal
#Dark Green colour: Strong bullish signal
#Lime: Bullish signal
NOTE: Also, you can untick the patterns you don't find useful, but I kept every pattern to get a complete script.
I unticked:
Morning Star
Evening Star
Shooting Star
Bullish Harami (too bearish on corrective phase)
Hanging Man
Red Cloud Cover
發行說明
*Added background RSI overbought/oversold signal to the price chart. You can untick it if you want!開源腳本
秉持TradingView一貫精神,這個腳本的創作者將其設為開源,以便交易者檢視並驗證其功能。向作者致敬!您可以免費使用此腳本,但請注意,重新發佈代碼需遵守我們的社群規範。
免責聲明
這些資訊和出版物並非旨在提供,也不構成TradingView提供或認可的任何形式的財務、投資、交易或其他類型的建議或推薦。請閱讀使用條款以了解更多資訊。
免責聲明
這些資訊和出版物並非旨在提供,也不構成TradingView提供或認可的任何形式的財務、投資、交易或其他類型的建議或推薦。請閱讀使用條款以了解更多資訊。