INVITE-ONLY SCRIPT
已更新 Open Interest and Liquidity [by Alpha_Precision_Charts]
Indicator Description: Open Interest and Liquidity [by Alpha_Precision_Charts]
Introduction:
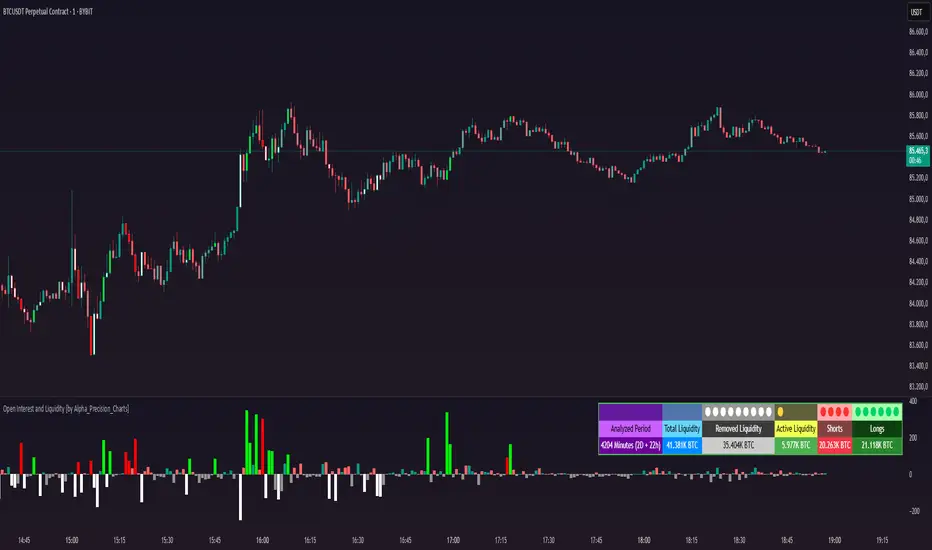
The "Open Interest and Liquidity" indicator is an advanced tool designed for traders seeking to analyze aggregated Open Interest (OI) flow and liquidity in the cryptocurrency market, with a special focus on Bitcoin. It combines high-quality Open Interest data, a detailed liquidity table, and a visual longs vs shorts gauge, providing a comprehensive real-time view of market dynamics. Ideal for scalpers, swing traders, and volume analysts, this indicator is highly customizable and optimized for 1-minute charts, though it works across other timeframes as well.
Key Features:
Aggregated Open Interest and Delta: Leverages Binance data for accuracy, allowing traders to switch between displaying absolute OI or OI Delta, with value conversion to base currency or USD.
Liquidity Table: Displays the analyzed period, active liquidity, shorts, and longs with visual proportion bars, functioning for various cryptocurrencies as long as Open Interest data is available.
Longs vs Shorts Gauge: A semicircle visual that shows real-time market sentiment, adjustable for chart positioning, helping identify imbalances, optimized and exclusive for Bitcoin on 1-minute charts.
Utilities:
Sentiment Analysis: Quickly detect whether the market is accumulating positions (longs/shorts) or liquidating (OI exits).
Pivot Identification: Highlight key moments of high buying or selling pressure, ideal for trade entries or exits.
Liquidity Monitoring: The table and gauge provide a clear view of active liquidity, helping assess a move’s strength.
Scalping and Day Trading: Perfect for short-term traders operating on 1-minute charts, offering fast and precise visual insights.
How to Use:
Initial Setup: Choose between "Open Interest" (candles) or "Open Interest Delta" (columns) in the "Display" field. The indicator defaults to Binance data for enhanced accuracy.
Customization: Enable/disable the table and gauge as needed and position them on the chart.
Interpretation: Combine OI Delta and gauge data with price movement to anticipate breakouts or reversals.
Technical Notes
The indicator uses a 500-period VWMA to calculate significant OI Delta thresholds and is optimized for Bitcoin (BTCUSDT.P) on high-liquidity charts.
Disclaimer
This indicator relies on the availability of Open Interest data on TradingView. For best results, use on Bitcoin charts with high liquidity, such as BTCUSDT.P. Accuracy may vary with lower-volume assets or exchanges.
Introduction:
The "Open Interest and Liquidity" indicator is an advanced tool designed for traders seeking to analyze aggregated Open Interest (OI) flow and liquidity in the cryptocurrency market, with a special focus on Bitcoin. It combines high-quality Open Interest data, a detailed liquidity table, and a visual longs vs shorts gauge, providing a comprehensive real-time view of market dynamics. Ideal for scalpers, swing traders, and volume analysts, this indicator is highly customizable and optimized for 1-minute charts, though it works across other timeframes as well.
Key Features:
Aggregated Open Interest and Delta: Leverages Binance data for accuracy, allowing traders to switch between displaying absolute OI or OI Delta, with value conversion to base currency or USD.
Liquidity Table: Displays the analyzed period, active liquidity, shorts, and longs with visual proportion bars, functioning for various cryptocurrencies as long as Open Interest data is available.
Longs vs Shorts Gauge: A semicircle visual that shows real-time market sentiment, adjustable for chart positioning, helping identify imbalances, optimized and exclusive for Bitcoin on 1-minute charts.
Utilities:
Sentiment Analysis: Quickly detect whether the market is accumulating positions (longs/shorts) or liquidating (OI exits).
Pivot Identification: Highlight key moments of high buying or selling pressure, ideal for trade entries or exits.
Liquidity Monitoring: The table and gauge provide a clear view of active liquidity, helping assess a move’s strength.
Scalping and Day Trading: Perfect for short-term traders operating on 1-minute charts, offering fast and precise visual insights.
How to Use:
Initial Setup: Choose between "Open Interest" (candles) or "Open Interest Delta" (columns) in the "Display" field. The indicator defaults to Binance data for enhanced accuracy.
Customization: Enable/disable the table and gauge as needed and position them on the chart.
Interpretation: Combine OI Delta and gauge data with price movement to anticipate breakouts or reversals.
Technical Notes
The indicator uses a 500-period VWMA to calculate significant OI Delta thresholds and is optimized for Bitcoin (BTCUSDT.P) on high-liquidity charts.
Disclaimer
This indicator relies on the availability of Open Interest data on TradingView. For best results, use on Bitcoin charts with high liquidity, such as BTCUSDT.P. Accuracy may vary with lower-volume assets or exchanges.
發行說明
Indicator Description: Open Interest and Liquidity [by Alpha_Precision_Charts]Introduction:
The "Open Interest and Liquidity" indicator is an advanced tool designed for traders seeking to analyze aggregated Open Interest (OI) flow and liquidity in the cryptocurrency market, with a special focus on Bitcoin. It combines high-quality Open Interest data, a detailed liquidity table, and a visual longs vs shorts gauge, providing a comprehensive real-time view of market dynamics. Ideal for scalpers, swing traders, and volume analysts, this indicator is highly customizable and optimized for 1-minute charts, though it works across other timeframes as well.
Key Features:
Aggregated Open Interest and Delta: Leverages Binance data for accuracy, allowing traders to switch between displaying absolute OI or OI Delta, with value conversion to base currency or USD.
Liquidity Table: Displays the analyzed period, active liquidity, shorts, and longs with visual proportion bars, functioning for various cryptocurrencies as long as Open Interest data is available.
Longs vs Shorts Gauge: A semicircle visual that shows real-time market sentiment, adjustable for chart positioning, helping identify imbalances, optimized and exclusive for Bitcoin on 1-minute charts.
Utilities:
Sentiment Analysis: Quickly detect whether the market is accumulating positions (longs/shorts) or liquidating (OI exits).
Pivot Identification: Highlight key moments of high buying or selling pressure, ideal for trade entries or exits.
Liquidity Monitoring: The table and gauge provide a clear view of active liquidity, helping assess a move’s strength.
Scalping and Day Trading: Perfect for short-term traders operating on 1-minute charts, offering fast and precise visual insights.
How to Use:
Initial Setup: Choose between "Open Interest" (candles) or "Open Interest Delta" (columns) in the "Display" field. The indicator defaults to Binance data for enhanced accuracy.
Customization: Enable/disable the table and gauge as needed and position them on the chart.
Interpretation: Combine OI Delta and gauge data with price movement to anticipate breakouts or reversals.
Technical Notes
The indicator uses a 500-period VWMA to calculate significant OI Delta thresholds and is optimized for Bitcoin (BTCUSDT.P) on high-liquidity charts.
Disclaimer
This indicator relies on the availability of Open Interest data on TradingView. For best results, use on Bitcoin charts with high liquidity, such as BTCUSDT.P. Accuracy may vary with lower-volume assets or exchanges.
僅限邀請腳本
僅作者批准的使用者才能訪問此腳本。您需要申請並獲得使用許可,通常需在付款後才能取得。更多詳情,請依照作者以下的指示操作,或直接聯絡Alpha_Precision_Charts。
TradingView不建議在未完全信任作者並了解其運作方式的情況下購買或使用腳本。您也可以在我們的社群腳本中找到免費的開源替代方案。
作者的說明
Access "Heatmap Longs/Shorts with OI Sensitivity & Aggregated Tools" requires a paid subscription. Contact us via TradingView private chat or email alpha.analytics2030@gmail.com for details.
免責聲明
這些資訊和出版物並非旨在提供,也不構成TradingView提供或認可的任何形式的財務、投資、交易或其他類型的建議或推薦。請閱讀使用條款以了解更多資訊。