OPEN-SOURCE SCRIPT
Fences
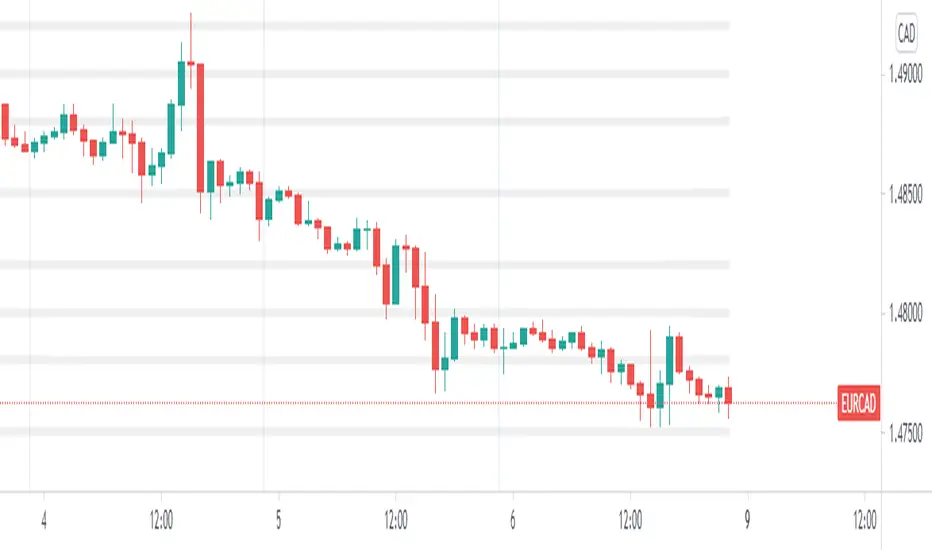
This is a simple script that plots horizontal grid on your chart using .x000 .x200 .x500 .x800 levels. Mike mentioned these levels in one of his videos.
Fences is only a semi-automatic indicator. You have to input the central point AND number of decimals yourself.
• Decimals are set to 3 but JPY pairs need it to be 1.
• Anchor point is the nearest level ending with three zeroes.
Fences is only a semi-automatic indicator. You have to input the central point AND number of decimals yourself.
• Decimals are set to 3 but JPY pairs need it to be 1.
• Anchor point is the nearest level ending with three zeroes.
發行說明
A few visuals changed to look better on my charts.In addition, N1 N2 and N3 are now floats. So if you prefer 25 pip boxes as opposed to 200, 500, 800 levels, it is possible to set up now.
開源腳本
秉持TradingView一貫精神,這個腳本的創作者將其設為開源,以便交易者檢視並驗證其功能。向作者致敬!您可以免費使用此腳本,但請注意,重新發佈代碼需遵守我們的社群規範。
免責聲明
這些資訊和出版物並非旨在提供,也不構成TradingView提供或認可的任何形式的財務、投資、交易或其他類型的建議或推薦。請閱讀使用條款以了解更多資訊。
開源腳本
秉持TradingView一貫精神,這個腳本的創作者將其設為開源,以便交易者檢視並驗證其功能。向作者致敬!您可以免費使用此腳本,但請注意,重新發佈代碼需遵守我們的社群規範。
免責聲明
這些資訊和出版物並非旨在提供,也不構成TradingView提供或認可的任何形式的財務、投資、交易或其他類型的建議或推薦。請閱讀使用條款以了解更多資訊。