PROTECTED SOURCE SCRIPT
已更新 [SC] BALANCE - LEVEL LINE
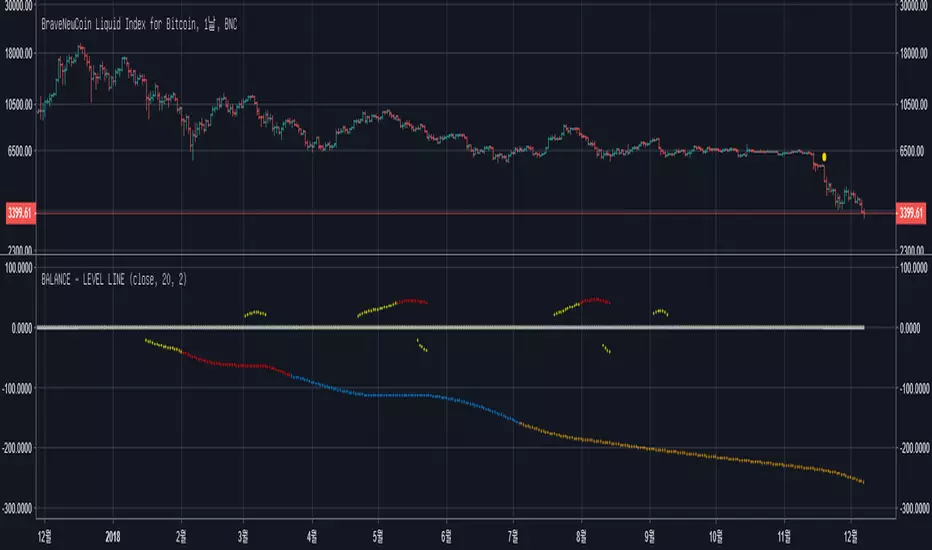
This indicator tracks the intersection of exponential moving averages.
For example, if multiple is 2 and the indicator shows a value of 11.1 at any one time, it means 'gold cross' of ema (close, 11.1) and ema (close, 22.2).
If multiple is 3, it means 'gold cross' of ema (colse, 11.1) and ema (colse, 33.3).
If it is a negative value, it means dead cross.
If ABS is checked, all values are expressed as positive numbers.
The range of the tracking period is 'initial period ~ initial period * 32'.
You can enter decimal numbers in initial period and multiple variables.
It is up to you to study how to use it.
이 지표는 지수이동평균선들의 교차값을 추적합니다.
예를 들어, multiple이 2인 경우, 어떤 한 시각에서 지표가 11.1의 값을 나타낸다면, 그것은 ema (close, 11.1)과 ema (close, 22.2)의 골드크로스를 의미합니다.
만약 multiple이 3인 경우라면, ema (colse, 11.1)과 ema (colse, 33.3)의 골드크로스를 의미합니다.
만약 음수 값이라면 그 값은 데드크로스를 의미합니다.
만약 ABS를 체크한다면 모든 값이 양수로 표현됩니다.
추적하는 기간의 범위는 'initial period ~ initial period * 32' 입니다.
initial period 와 multiple 변수로 소수를 입력할 수 있습니다.
활용법의 연구는 여러분의 몫입니다.
發行說明
I changed the plot from line to cross for visibility.發行說明
Increased the transparency of the plot.受保護腳本
此腳本以閉源形式發佈。 不過,您可以自由使用,沒有任何限制 — 點擊此處了解更多。
免責聲明
這些資訊和出版物並非旨在提供,也不構成TradingView提供或認可的任何形式的財務、投資、交易或其他類型的建議或推薦。請閱讀使用條款以了解更多資訊。
受保護腳本
此腳本以閉源形式發佈。 不過,您可以自由使用,沒有任何限制 — 點擊此處了解更多。
免責聲明
這些資訊和出版物並非旨在提供,也不構成TradingView提供或認可的任何形式的財務、投資、交易或其他類型的建議或推薦。請閱讀使用條款以了解更多資訊。