PROTECTED SOURCE SCRIPT
Gann Square Time
Hello, friends. I want to introduce you to the Gann Square Time indicator. It is built on methods based on Gann's Square of 9. William Delbert Gann believed that it is essential to consider not only price levels but also time levels, and I will say more, he placed even greater importance on this. Gann said, "Time is more important than price. When time runs out, price will reverse." So, let's use his works and experience.
How is this indicator structured?
It calculates time levels based on the numerical sequences of the Square of 9. How does this work?
First, we need to define the impulse. More precisely, we need to determine its duration. The duration of the impulse cannot be less than 2 bars and cannot exceed 9 bars. If you determine that the impulse lasted 2 bars, the numerical sequence will be based on 180 degrees, and all dates will be constructed based on these values. If the impulse lasts for 3 bars, the numerical sequence for calculating dates will be taken from 135 degrees, and so on until the impulse is defined by nine bars. At this duration, the numerical sequence will be taken from 225 degrees.
If you find that your impulse should be less than 2 bars or greater than 9, you should switch to a more suitable timeframe and determine the impulse on it to avoid errors.

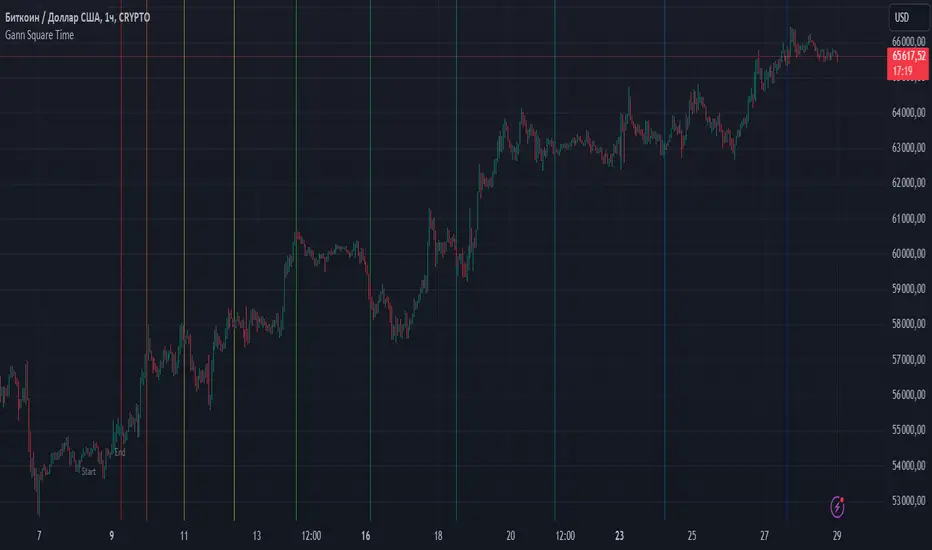
The boundaries of the impulse are defined by two timestamps. The first is labeled "Start," and the second as "End." Once you define the boundaries of the impulse, your levels will be constructed. You can work on any timeframe. If the indicator shows an error, you probably have too many levels projected into the future; in the settings, you should disable the excess levels, and then the indicator will work again. By default, I have turned off the last 5 levels, but if necessary, you can use them.
It is best to use it with other methods of your analysis, and if your analysis shows that the price has reached a strong support or resistance level, and there is also a projected date at that point, it will be a stronger signal for you.
Good luck using the indicator, and remember: Do not decide for the price where it should go,
let it reveal itself and confirm.
How is this indicator structured?
It calculates time levels based on the numerical sequences of the Square of 9. How does this work?
First, we need to define the impulse. More precisely, we need to determine its duration. The duration of the impulse cannot be less than 2 bars and cannot exceed 9 bars. If you determine that the impulse lasted 2 bars, the numerical sequence will be based on 180 degrees, and all dates will be constructed based on these values. If the impulse lasts for 3 bars, the numerical sequence for calculating dates will be taken from 135 degrees, and so on until the impulse is defined by nine bars. At this duration, the numerical sequence will be taken from 225 degrees.
If you find that your impulse should be less than 2 bars or greater than 9, you should switch to a more suitable timeframe and determine the impulse on it to avoid errors.
The boundaries of the impulse are defined by two timestamps. The first is labeled "Start," and the second as "End." Once you define the boundaries of the impulse, your levels will be constructed. You can work on any timeframe. If the indicator shows an error, you probably have too many levels projected into the future; in the settings, you should disable the excess levels, and then the indicator will work again. By default, I have turned off the last 5 levels, but if necessary, you can use them.
It is best to use it with other methods of your analysis, and if your analysis shows that the price has reached a strong support or resistance level, and there is also a projected date at that point, it will be a stronger signal for you.
Good luck using the indicator, and remember: Do not decide for the price where it should go,
let it reveal itself and confirm.
受保護腳本
此腳本以閉源形式發佈。 不過,您可以自由使用,沒有任何限制 — 點擊此處了解更多。
💡 Обсуждаем торговые идеи , делимся индикаторами и стратегиями в нашем Telegram-чате:
👉 t.me/+AQWwxRhhrXI0YTgy
👉 t.me/+AQWwxRhhrXI0YTgy
免責聲明
這些資訊和出版物並非旨在提供,也不構成TradingView提供或認可的任何形式的財務、投資、交易或其他類型的建議或推薦。請閱讀使用條款以了解更多資訊。
受保護腳本
此腳本以閉源形式發佈。 不過,您可以自由使用,沒有任何限制 — 點擊此處了解更多。
💡 Обсуждаем торговые идеи , делимся индикаторами и стратегиями в нашем Telegram-чате:
👉 t.me/+AQWwxRhhrXI0YTgy
👉 t.me/+AQWwxRhhrXI0YTgy
免責聲明
這些資訊和出版物並非旨在提供,也不構成TradingView提供或認可的任何形式的財務、投資、交易或其他類型的建議或推薦。請閱讀使用條款以了解更多資訊。