INVITE-ONLY SCRIPT
已更新 BTC Precognition - Mtrl_Scientist (Multi Time-Frame)
Hi everyone,
This indicator is also based on the "BTC Precognition" algorithm, only this time, I've visualized the results on all time frames (1min, 5min, 15min,...,1W). It is supposed to give you confidence in the signals the algorithm already offers.
How it works:
The top blocks are the shorter time frames, whereas the bottom blocks are the longer time frames. As you can see, the signals gradually leak into the longer time frames when a trend is confirmed.
I'm still trying to find patterns, but the most obvious to me was that the best entry is signaled when most blocks of the same color are stacked (marked on chart).
Very good buy signals are often 7-8 green blocks (out of 10) in a row, whereas very good exit signals are 10/10 red blocks.
Note: For best results use Heikin Ashi.
This is still very much work-in-progress, so I'm only publishing it as a private build.
PM me if you want to help test and improve it.
P.S.
As it is with Trading View, accessing higher time frames can lead to repainting. After a lengthy debugging process, it looks like I fixed the repainting issue for higher time frames. However, now there's an issue with skewed calculations on the current time frame (selected time frame == block time frame), that I've only solved for the 1min chart so far (should be possible to fix on all). So please just keep that in mind. As it is now, I'd say everything is correctly displayed on the 1min chart only! You can verify this by refreshing the page and checking if any blocks changed. If they didn't, there's no repaint.
發行說明
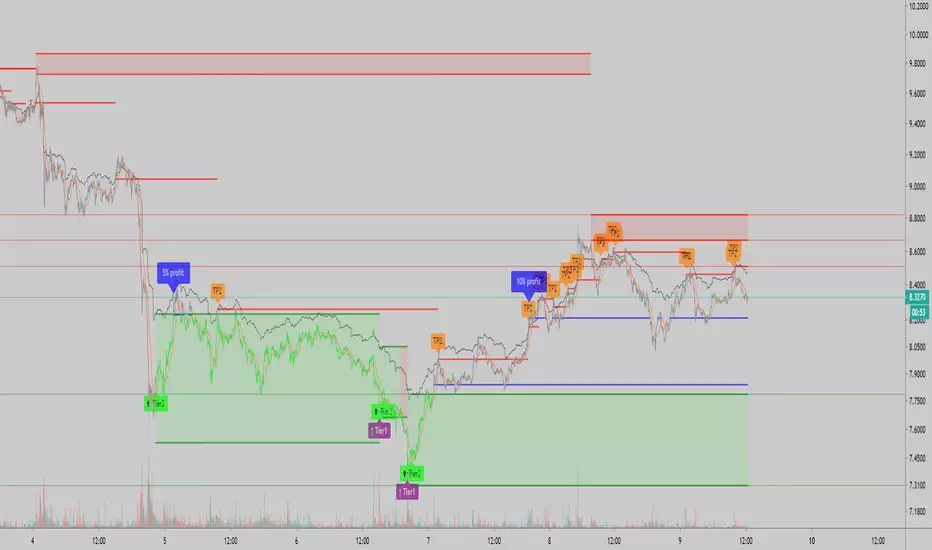
Temporarilty repurposing this script for testing.The indicator shows the deviation from the mean-line (black in top chart). As can be seen, you can identify horizontal as well as diagonal S/Rs to determine the maximum deviation from the mean line and thus you are able to catch knives and sell tops.
發行說明
Dev build of MTF Deviation發行說明
Dev Branch - added some fancy new stuff for testing發行說明
another update發行說明
dev update發行說明
dev update發行說明
dev update發行說明
dev update發行說明
Dev update發行說明
dev update發行說明
dev update發行說明
dev update發行說明
dev update發行說明
dev update (exp version)發行說明
dev update (0% deviation)發行說明
dev update僅限邀請腳本
僅作者批准的使用者才能訪問此腳本。您需要申請並獲得使用許可,通常需在付款後才能取得。更多詳情,請依照作者以下的指示操作,或直接聯絡Mtrl_Scientist。
TradingView不建議在未完全信任作者並了解其運作方式的情況下購買或使用腳本。您也可以在我們的社群腳本中找到免費的開源替代方案。
作者的說明
Material Indicators
免責聲明
這些資訊和出版物並非旨在提供,也不構成TradingView提供或認可的任何形式的財務、投資、交易或其他類型的建議或推薦。請閱讀使用條款以了解更多資訊。
僅限邀請腳本
僅作者批准的使用者才能訪問此腳本。您需要申請並獲得使用許可,通常需在付款後才能取得。更多詳情,請依照作者以下的指示操作,或直接聯絡Mtrl_Scientist。
TradingView不建議在未完全信任作者並了解其運作方式的情況下購買或使用腳本。您也可以在我們的社群腳本中找到免費的開源替代方案。
作者的說明
Material Indicators
免責聲明
這些資訊和出版物並非旨在提供,也不構成TradingView提供或認可的任何形式的財務、投資、交易或其他類型的建議或推薦。請閱讀使用條款以了解更多資訊。