OPEN-SOURCE SCRIPT
Relative Measured Volatility (RMV)
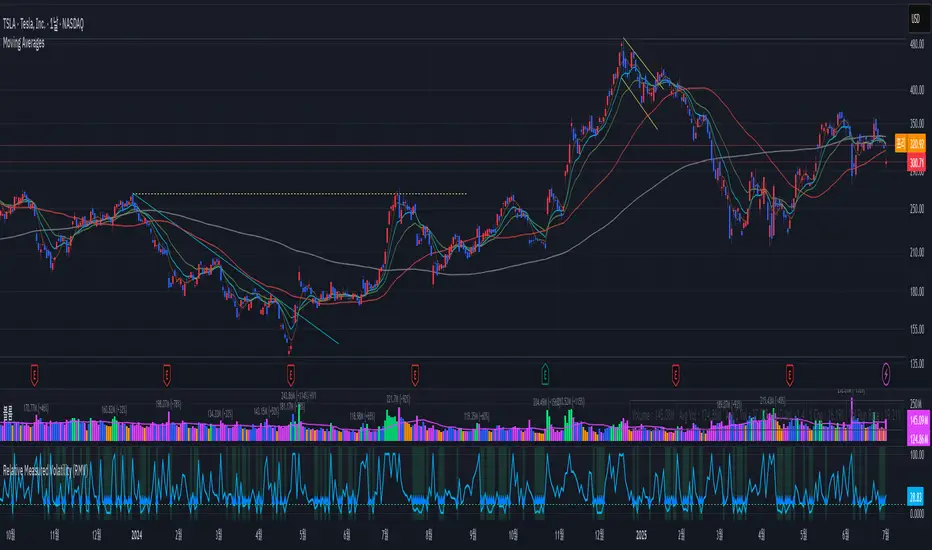
RMV • Volume-Sensitive Consolidation Indicator
A lightweight Pine Script that highlights true low-volatility, low-volume bars in a single squeeze measure.

What it does
Calculates each bar’s raw High-Low range.
Down-weights bars where volume is below its 30-day average, emphasizing genuine quiet periods.
Normalizes the result over the prior 15 bars (excluding the current bar), scaling from 0 (tightest) to 100 (most volatile).
Draws the series as a step plot, shades true “tight” bars below the user threshold, and marks sustained squeezes with a small arrow.
Key inputs
Lookback (bars): Number of bars to use for normalization (default 15).
Tight Threshold: RMV value under which a bar is considered squeezed (default 15).
Volume SMA Period: Period for the volume moving average benchmark (default 30).
How it works
Raw range: barRange = high - low
Volume ratio: volRatio = min(volume / sma(volume,30), 1)
Weighted range: vwRange = barRange * volRatio
Rolling min/max (prior 15 bars): exclude today so a new low immediately registers a 0.
Normalize: rmv = clamp(100 * (vwRange - min) / (max - min), 0, 100)
Visualization & signals
Step line for exact bar-by-bar values.
Shaded background when RMV < threshold.
Consecutive-bar filter ensures arrows only appear when tightness lasts at least two bars, cutting noise.
Why use it
Quickly spot consolidation zones that combine narrow price action with genuine dry volume—ideal for swing entries ahead of breakouts.
A lightweight Pine Script that highlights true low-volatility, low-volume bars in a single squeeze measure.
What it does
Calculates each bar’s raw High-Low range.
Down-weights bars where volume is below its 30-day average, emphasizing genuine quiet periods.
Normalizes the result over the prior 15 bars (excluding the current bar), scaling from 0 (tightest) to 100 (most volatile).
Draws the series as a step plot, shades true “tight” bars below the user threshold, and marks sustained squeezes with a small arrow.
Key inputs
Lookback (bars): Number of bars to use for normalization (default 15).
Tight Threshold: RMV value under which a bar is considered squeezed (default 15).
Volume SMA Period: Period for the volume moving average benchmark (default 30).
How it works
Raw range: barRange = high - low
Volume ratio: volRatio = min(volume / sma(volume,30), 1)
Weighted range: vwRange = barRange * volRatio
Rolling min/max (prior 15 bars): exclude today so a new low immediately registers a 0.
Normalize: rmv = clamp(100 * (vwRange - min) / (max - min), 0, 100)
Visualization & signals
Step line for exact bar-by-bar values.
Shaded background when RMV < threshold.
Consecutive-bar filter ensures arrows only appear when tightness lasts at least two bars, cutting noise.
Why use it
Quickly spot consolidation zones that combine narrow price action with genuine dry volume—ideal for swing entries ahead of breakouts.
開源腳本
秉持TradingView一貫精神,這個腳本的創作者將其設為開源,以便交易者檢視並驗證其功能。向作者致敬!您可以免費使用此腳本,但請注意,重新發佈代碼需遵守我們的社群規範。
免責聲明
這些資訊和出版物並非旨在提供,也不構成TradingView提供或認可的任何形式的財務、投資、交易或其他類型的建議或推薦。請閱讀使用條款以了解更多資訊。
開源腳本
秉持TradingView一貫精神,這個腳本的創作者將其設為開源,以便交易者檢視並驗證其功能。向作者致敬!您可以免費使用此腳本,但請注意,重新發佈代碼需遵守我們的社群規範。
免責聲明
這些資訊和出版物並非旨在提供,也不構成TradingView提供或認可的任何形式的財務、投資、交易或其他類型的建議或推薦。請閱讀使用條款以了解更多資訊。