OPEN-SOURCE SCRIPT
已更新 New Highs - Marker
Description:
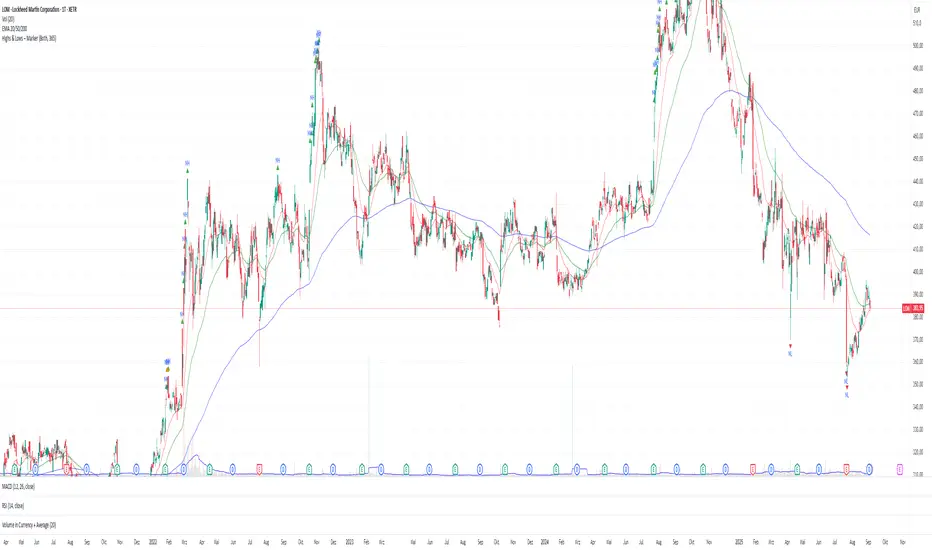
Use this tool to quickly spot breakouts or double-top style patterns as they form.
- This indicator highlights every bar that sets a new high or matches the previous high.
- New Highs (ATH or Lookback Highs) are marked with a green triangle above the candle.
- Equal Highs (ties) are marked with an orange triangle above the candle.
- You can choose between All-Time Highs (lookback = 0) or rolling lookback highs over a user-defined number of bars.
- Alerts are included for both new highs and equal highs.
Use this tool to quickly spot breakouts or double-top style patterns as they form.
發行說明
--this updated version now also shows new lows--New Highs & New Lows – Marker
This indicator automatically highlights new highs and lows on your chart. It works in two modes:
Lookback Mode (Lookback > 0): Marks new highs or lows relative to the last N bars.
Both new extremes and equal highs/lows (ties) can be visualized with different colors and shapes. Alerts are included so you can be notified as soon as new highs or lows appear.
Use this tool to quickly spot breakouts, double tops/bottoms, or potential support/resistance levels.
Features
✅ Detect new highs and new lows
✅ Highlight equal highs and lows (ties)
✅ All-Time or rolling lookback mode
✅ Option to show only highs, only lows, or both
✅ Customizable colors and markers
✅ Built-in alerts for all conditions
Inputs & Settings
Mode: Choose between
B
- oth → Show both highs and lows
- Only Highs → Show only highs
- On
Lookback:
- 0 → All-Time Highs/Lows (since the beginning of the chart)
- >0 → Rolling highs/lows based on the last N bars
- Show New Highs/Lows: Toggle visibility of fresh highs/lows
- S
Colors:
- Green → New Highs
- Orange → Equal Highs
- Red → New Lows
- Ora
Alerts
The indicator includes 4 alert conditions:
- New High – when a bar creates a higher high
- Equal High – when a bar touches the same high
- New Low – when a bar creates a lower low
- Equal Low – when a bar touches the same low
- To enab
How to Use
Add the indicator to your chart.
Choose Lookback = 0 to track all-time highs/lows, or set a number (e.g., 20) for a rolling window.
Select Mode → Highs only, Lows only, or Both.
Customize colors and alerts to fit your strategy.
Watch for markers above/below bars:
Triangles Up (above candles) → Highs
Triangles Down (below candles) → Lows
開源腳本
秉持TradingView一貫精神,這個腳本的創作者將其設為開源,以便交易者檢視並驗證其功能。向作者致敬!您可以免費使用此腳本,但請注意,重新發佈代碼需遵守我們的社群規範。
免責聲明
這些資訊和出版物並非旨在提供,也不構成TradingView提供或認可的任何形式的財務、投資、交易或其他類型的建議或推薦。請閱讀使用條款以了解更多資訊。
免責聲明
這些資訊和出版物並非旨在提供,也不構成TradingView提供或認可的任何形式的財務、投資、交易或其他類型的建議或推薦。請閱讀使用條款以了解更多資訊。