OPEN-SOURCE SCRIPT
Supply & Demand Zones (by Wali Afridi)
Description:
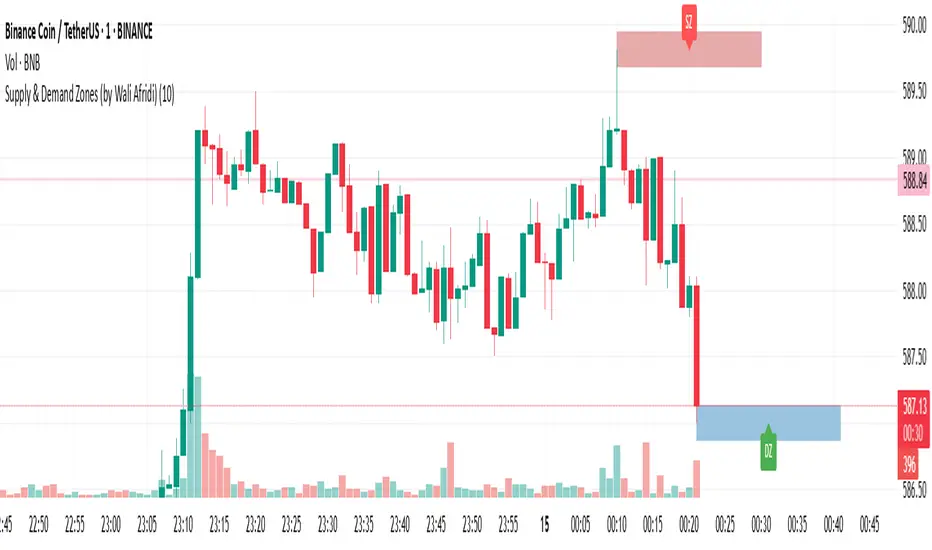
🚀 This indicator accurately detects Supply & Demand Zones by identifying swing highs and lows. It plots a single clean line for each zone and labels them as "SZ" (Supply Zone) and "DZ" (Demand Zone), ensuring a clear and minimalistic chart.
🔹 Features:
✅ Auto-detects recent Supply & Demand Zones
✅ Plots clean horizontal lines for the latest zones
✅ Displays "SZ" above the supply line & "DZ" below the demand line
✅ No duplicate labels—only one label per zone
✅ Minimal & clutter-free visualization
How to Use:
1️⃣ Add the indicator to your chart
2️⃣ Watch for Supply Zones (SZ) appearing above red lines – These indicate potential resistance areas where price may reverse or consolidate.
3️⃣ Watch for Demand Zones (DZ) appearing below green lines – These indicate strong support areas where price may bounce.
4️⃣ Use with other confirmations (Price Action, SMC, Volume) for better accuracy.
⚠️ Disclaimer:
This script is for educational purposes only and should not be considered financial advice. Always backtest and use risk management before applying it to live trading.
開源腳本
本著TradingView的真正精神,此腳本的創建者將其開源,以便交易者可以查看和驗證其功能。向作者致敬!雖然您可以免費使用它,但請記住,重新發佈程式碼必須遵守我們的網站規則。
免責聲明
這些資訊和出版物並不意味著也不構成TradingView提供或認可的金融、投資、交易或其他類型的意見或建議。請在使用條款閱讀更多資訊。
開源腳本
本著TradingView的真正精神,此腳本的創建者將其開源,以便交易者可以查看和驗證其功能。向作者致敬!雖然您可以免費使用它,但請記住,重新發佈程式碼必須遵守我們的網站規則。
免責聲明
這些資訊和出版物並不意味著也不構成TradingView提供或認可的金融、投資、交易或其他類型的意見或建議。請在使用條款閱讀更多資訊。