INVITE-ONLY SCRIPT
MACD CFF Edition
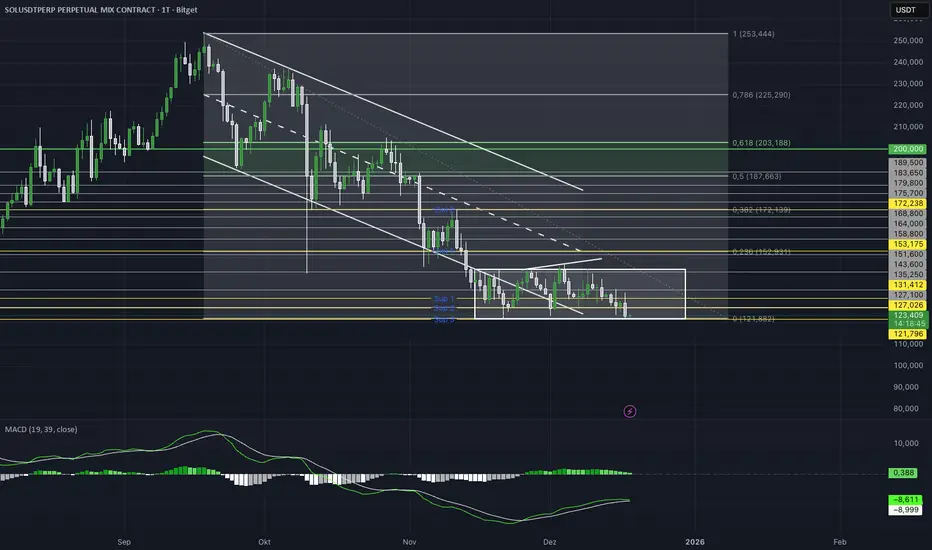
MACD (19 / 39) – Higher Timeframe Momentum
This indicator is a modified MACD version designed specifically for higher timeframes and structural market moves.
Compared to the standard MACD (12 / 26), the periods are intentionally extended to reduce short-term noise and focus on meaningful momentum and trend shifts.
The classic MACD (12 / 26) reacts very quickly and often produces many signals on lower and mid timeframes that mainly reflect micro-volatility.
Using 19 / 39 deliberately slows the indicator down and filters out movements that lack relevance for higher-timeframe market structure.
Line Explanation
White Line – MACD Line (19–39)
This line measures the distance between short-term and mid-term momentum.
It highlights structural changes in capital flow.
Above zero → bullish structural momentum
Below zero → bearish structural momentum
Green Line – Signal Line
A smoothed version of the MACD line.
Used for confirmation, not for fast entry signals.
Crossovers should be interpreted as context confirmation, not buy or sell commands.
Histogram
Displays the distance between the MACD line and the signal line.
Helps identify whether momentum is:
expanding
or weakening
Intended Use
• Best suited for 4H, Daily and Weekly
• Trend and directional bias filter
• Structural confirmation
• Works best combined with price action and key levels
Not a scalping tool. Not a standalone signal indicator.
免責聲明
這些資訊和出版物並非旨在提供,也不構成TradingView提供或認可的任何形式的財務、投資、交易或其他類型的建議或推薦。請閱讀使用條款以了解更多資訊。