OPEN-SOURCE SCRIPT
EMA_HMA_RSI_Strategy
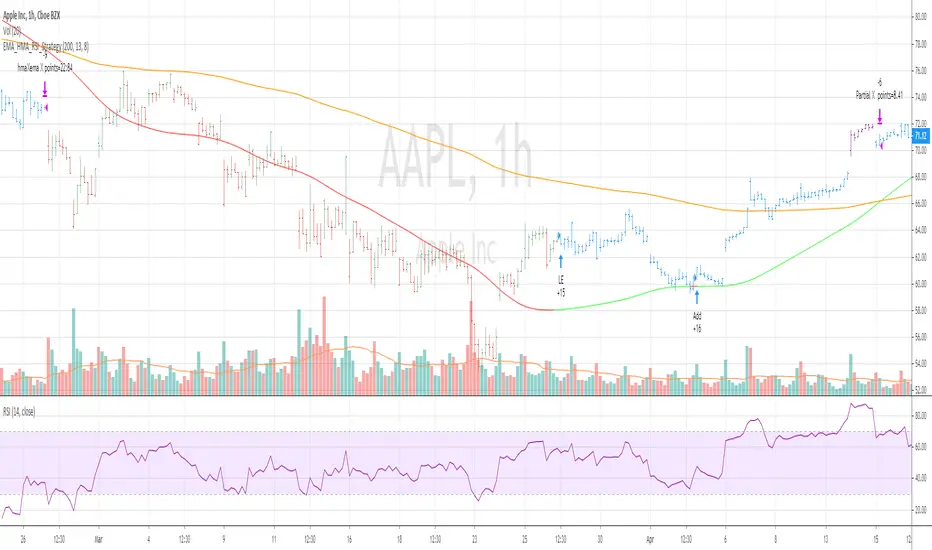
This strategy BUYS when HMA is below EMA (default setting is 200) and HMA turning to green and RSI 13 is below 70
Adds to existing position when current price is below BUY price and RSI crossing above 30 or 40
Exits the long position when HMA crosses down EMA
when you select Take Profit setting , partial profits are taken when current price > BUY price and RSI 13 crossing down 80
Bar color changes to purple when RSI13 is above 80 (if only in Long position exists)
Tested for SPY QQQ AAPL on hourly and 30 mins chart
Warning : For educational purposes only
開源腳本
秉持TradingView一貫精神,這個腳本的創作者將其設為開源,以便交易者檢視並驗證其功能。向作者致敬!您可以免費使用此腳本,但請注意,重新發佈代碼需遵守我們的社群規範。
免責聲明
這些資訊和出版物並非旨在提供,也不構成TradingView提供或認可的任何形式的財務、投資、交易或其他類型的建議或推薦。請閱讀使用條款以了解更多資訊。
免責聲明
這些資訊和出版物並非旨在提供,也不構成TradingView提供或認可的任何形式的財務、投資、交易或其他類型的建議或推薦。請閱讀使用條款以了解更多資訊。