OPEN-SOURCE SCRIPT
已更新 TTM FCFF Yield %
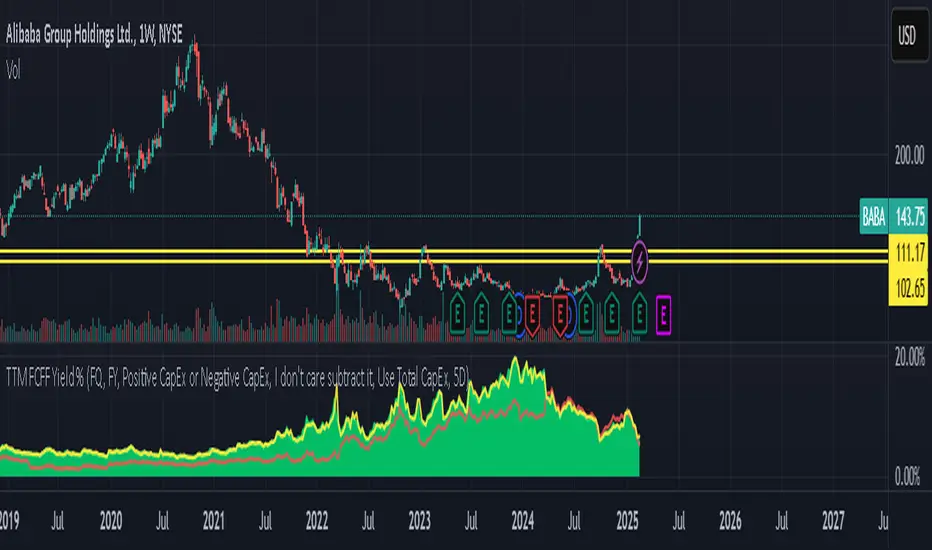
An indicator that shows the Free Cash Flow yield daily for the underlying ticker. Useful for when you need to screen for ideas, or the news just broke out and you want to make a calculated purchase - rather than buying at whatever price it is at the moment.
Green line tracks daily Free Cash Flow yield to Enterprise Value.
Where Free Cash Flow is defined as = Cashflow from Operations + Depreciation and Amortization (from the income statement) - Capital Expenditure (fixed assets) - Change in Working Capital
And where Enterprise Value is defined as = Market Capitalization + Net Debt
Red line tracks Free Cash Flow of financial year and what FCFF yield does that equate to if the stock current trades at the price right now.
Reminder: When working with international equities. Be mindful of whether they report FQ or FH. For example, France only reports FH, so it's better to use TTM FHFree Cash Flow results. If you didn't toggle FH in the indicator settings, it will automatically set as FQ and it will not show anything.
GLHF
發行說明
Added new feature to calculate FCFF Yield % using historical prices in case there is market noise. As negative FCFF Yield % looks like it is treading back into positive territory, but in reality it is just because EV is calculated using Market Capitalization which drags it upwards.發行說明
Patched!發行說明
Patch 2.發行說明
Patch 3 lol發行說明
Last patch I promise lol開源腳本
秉持TradingView一貫精神,這個腳本的創作者將其設為開源,以便交易者檢視並驗證其功能。向作者致敬!您可以免費使用此腳本,但請注意,重新發佈代碼需遵守我們的社群規範。
免責聲明
這些資訊和出版物並非旨在提供,也不構成TradingView提供或認可的任何形式的財務、投資、交易或其他類型的建議或推薦。請閱讀使用條款以了解更多資訊。
開源腳本
秉持TradingView一貫精神,這個腳本的創作者將其設為開源,以便交易者檢視並驗證其功能。向作者致敬!您可以免費使用此腳本,但請注意,重新發佈代碼需遵守我們的社群規範。
免責聲明
這些資訊和出版物並非旨在提供,也不構成TradingView提供或認可的任何形式的財務、投資、交易或其他類型的建議或推薦。請閱讀使用條款以了解更多資訊。