OPEN-SOURCE SCRIPT
已更新 Percentage up/down
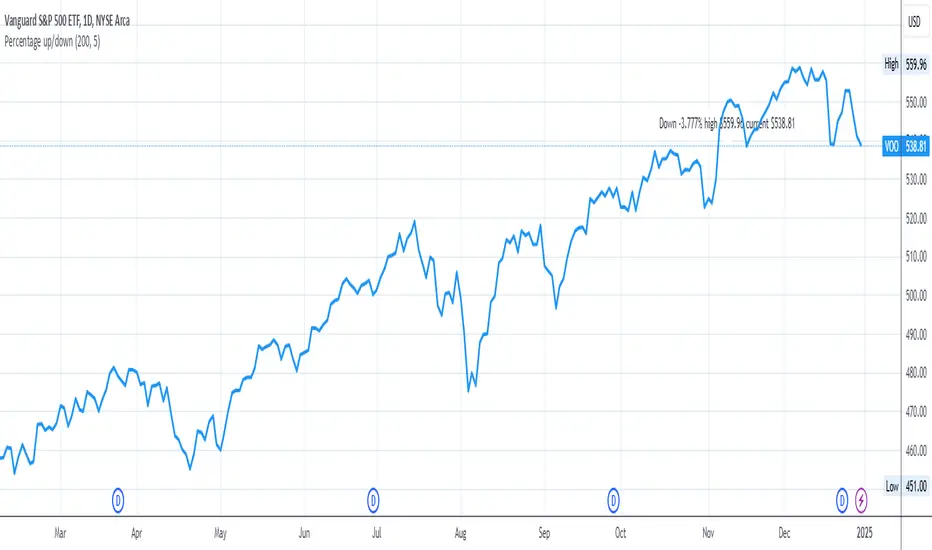
In order to buy stocks, I want to know how much the stock went down from the all-time high price. Therefore, this script shows how much the current stock has dropped from the all-time high.
You can change:
- how many periods to get the all-time high from
- location on the y-axis to place the label on the chart
You can change:
- how many periods to get the all-time high from
- location on the y-axis to place the label on the chart
發行說明
Updated script to version 6Changed the text and background color to make the text visible
開源腳本
秉持TradingView一貫精神,這個腳本的創作者將其設為開源,以便交易者檢視並驗證其功能。向作者致敬!您可以免費使用此腳本,但請注意,重新發佈代碼需遵守我們的社群規範。
免責聲明
這些資訊和出版物並非旨在提供,也不構成TradingView提供或認可的任何形式的財務、投資、交易或其他類型的建議或推薦。請閱讀使用條款以了解更多資訊。
免責聲明
這些資訊和出版物並非旨在提供,也不構成TradingView提供或認可的任何形式的財務、投資、交易或其他類型的建議或推薦。請閱讀使用條款以了解更多資訊。