OPEN-SOURCE SCRIPT
已更新 OBV's %B
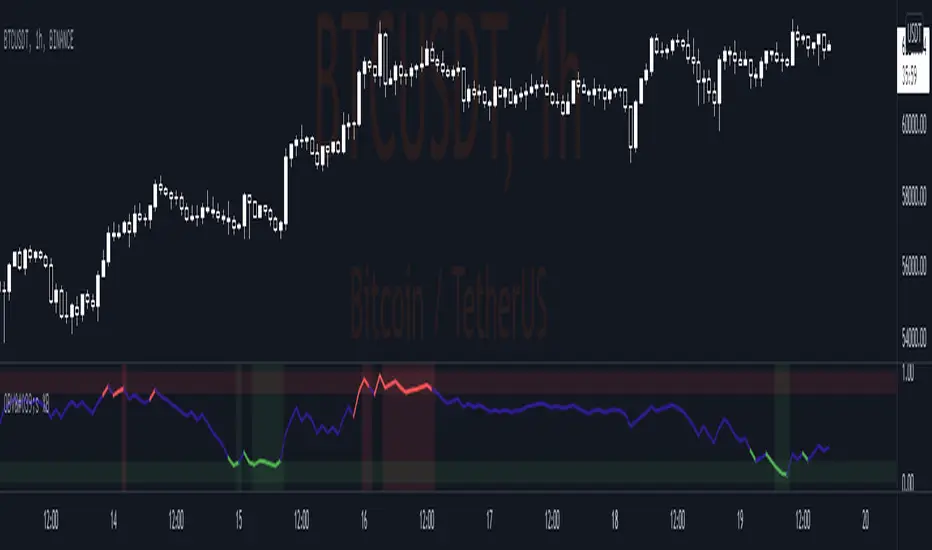
Indicator display where OBV (On Balance Volume) is in relation to the bands of Bollinger Bands (OBV,100,3)
A. OBV's Bb Info
1. Basis = SMA (OBV,100)
2. Upper Band = Basis + 3 x Standard Deviation
3. Lower Band = Basis - 3 x Standard Deviation
B. OBV's %B Info
1. %B Above 1 = OBV is Above the Upper Band
2. %B Below 0 = OBV is Below the Lower Band
3. %B Above 0.8 = OBV is Nearing the Upper Band
4. %B Below 0.20 = OBV is Nearing the Lower Band
發行說明
* Update to Pine version 5* Add Signal Background
* Buy Signal:
- When obv inside Support Zone (0.0 - 0.2)
* Sell Signal:
- When obv inside Resistance Zone (0.8 - 1.0)
開源腳本
秉持TradingView一貫精神,這個腳本的創作者將其設為開源,以便交易者檢視並驗證其功能。向作者致敬!您可以免費使用此腳本,但請注意,重新發佈代碼需遵守我們的社群規範。
免責聲明
這些資訊和出版物並非旨在提供,也不構成TradingView提供或認可的任何形式的財務、投資、交易或其他類型的建議或推薦。請閱讀使用條款以了解更多資訊。
免責聲明
這些資訊和出版物並非旨在提供,也不構成TradingView提供或認可的任何形式的財務、投資、交易或其他類型的建議或推薦。請閱讀使用條款以了解更多資訊。